Vector-based Analysis Overview
GeoRetina AI provides powerful tools for analyzing vector data through a natural language interface. Vector data represents geographic features as points, lines, and polygons, allowing for precise spatial analysis of discrete objects. Users have access to comprehensive datasets including OpenStreetMap (OSM) and Overture Maps data for global coverage.
Key Capabilities
GeoRetina AI's vector analysis system offers three main capabilities:
1. Public Data Querying
Access and analyze data from leading open vector datasets:
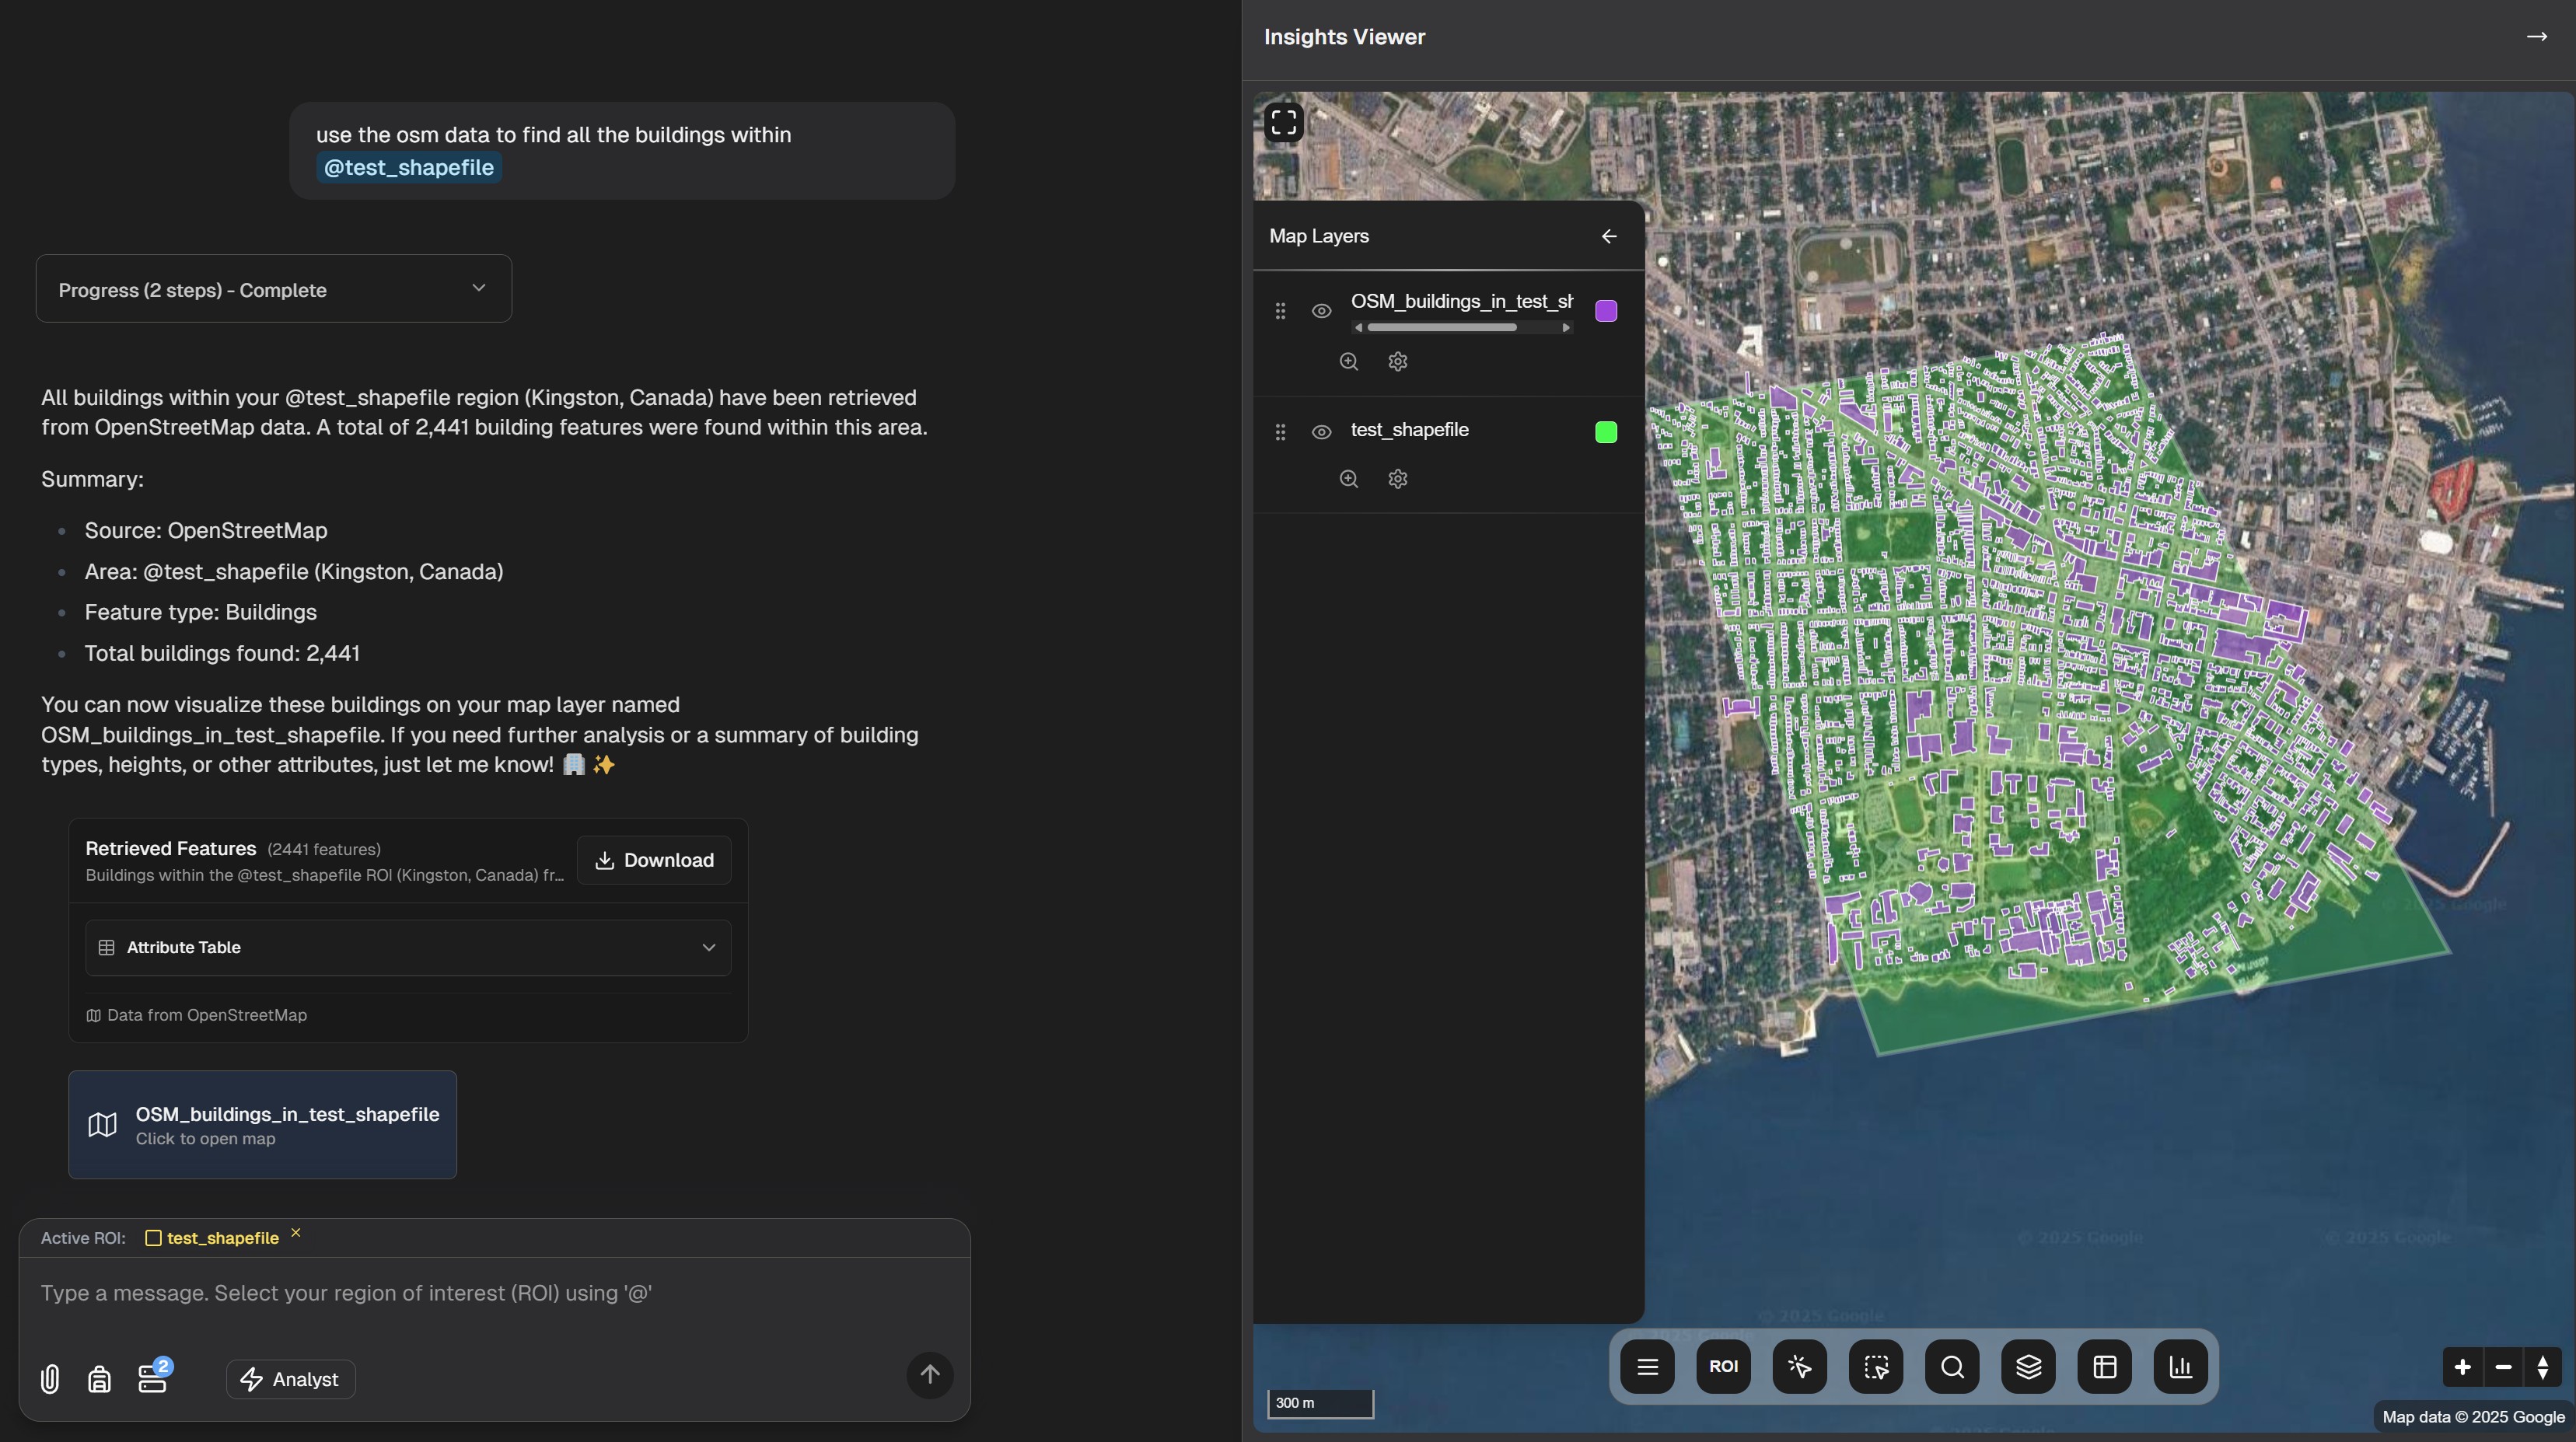
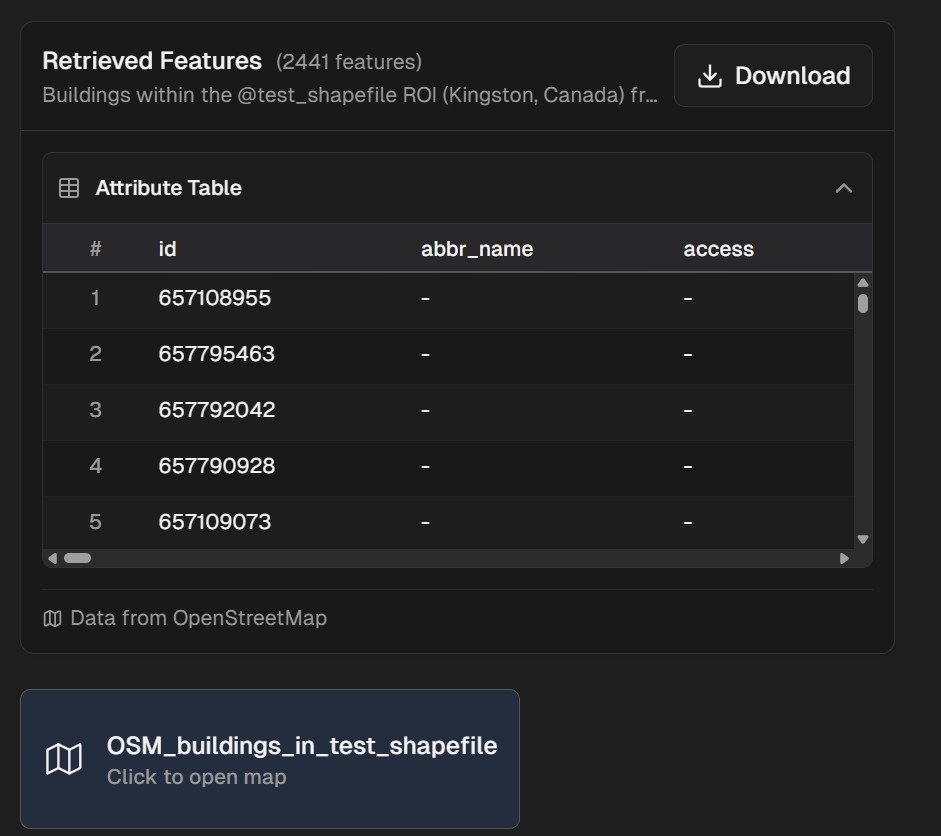
- OpenStreetMap: Query global infrastructure data including buildings, roads, points of interest, and natural features
- Overture Maps: Access Overture's comprehensive mapping data with rich attribution and global coverage
2. Custom Data Integration
Upload and query your own geospatial data:
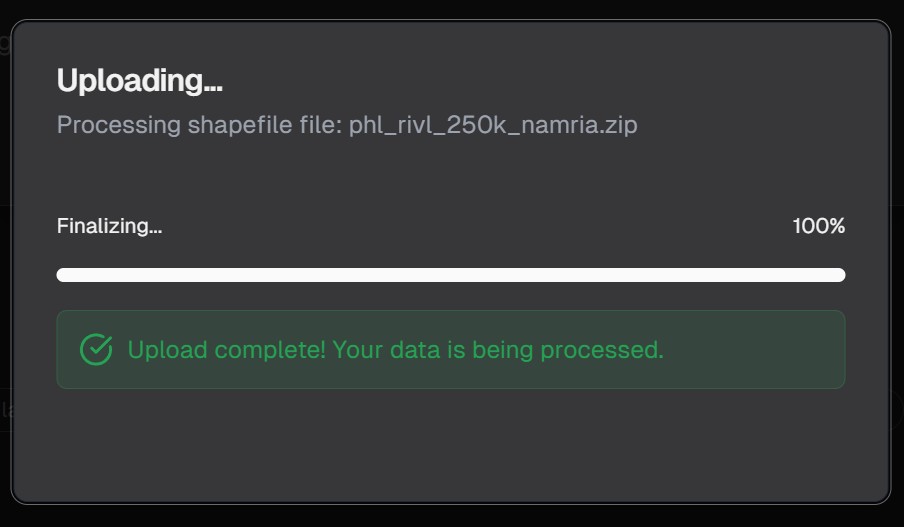
- Import GeoJSON, Shapefiles, and other vector formats
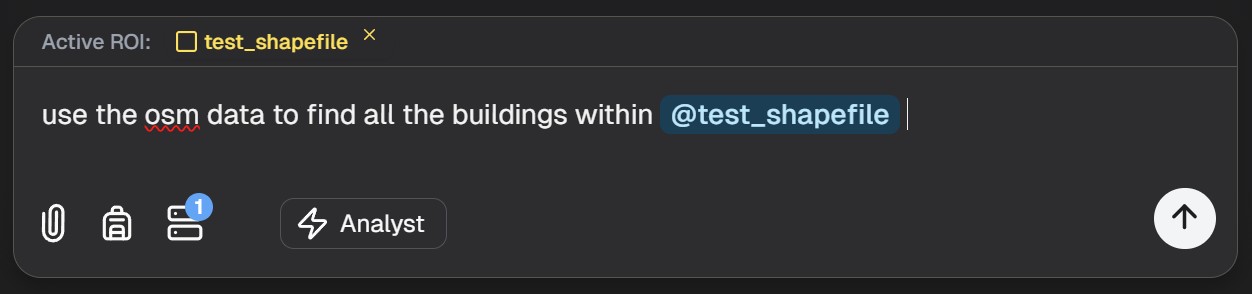
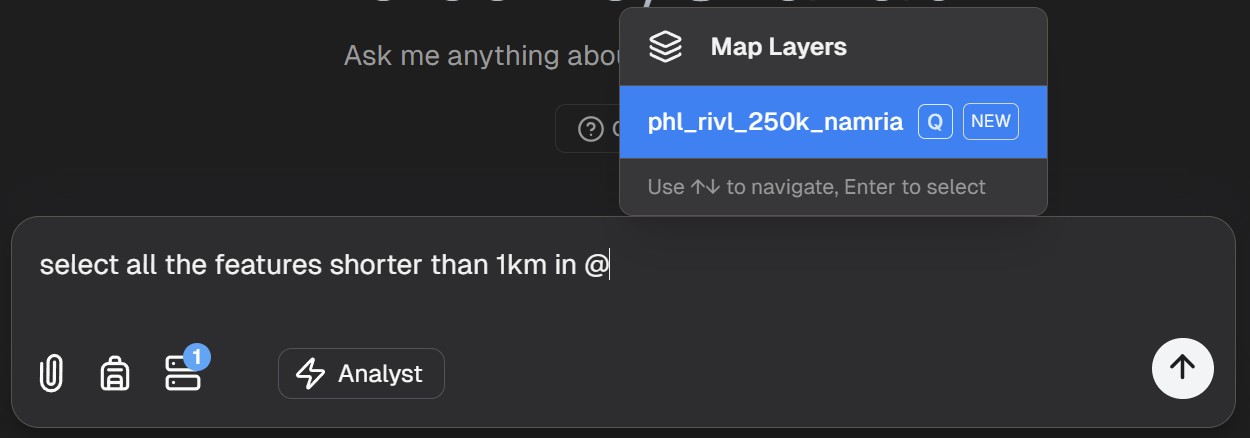
- Query your data using the same natural language interface
- Combine your data with public datasets for comprehensive analysis
3. Query Loops
Perform iterative, multi-step analysis:
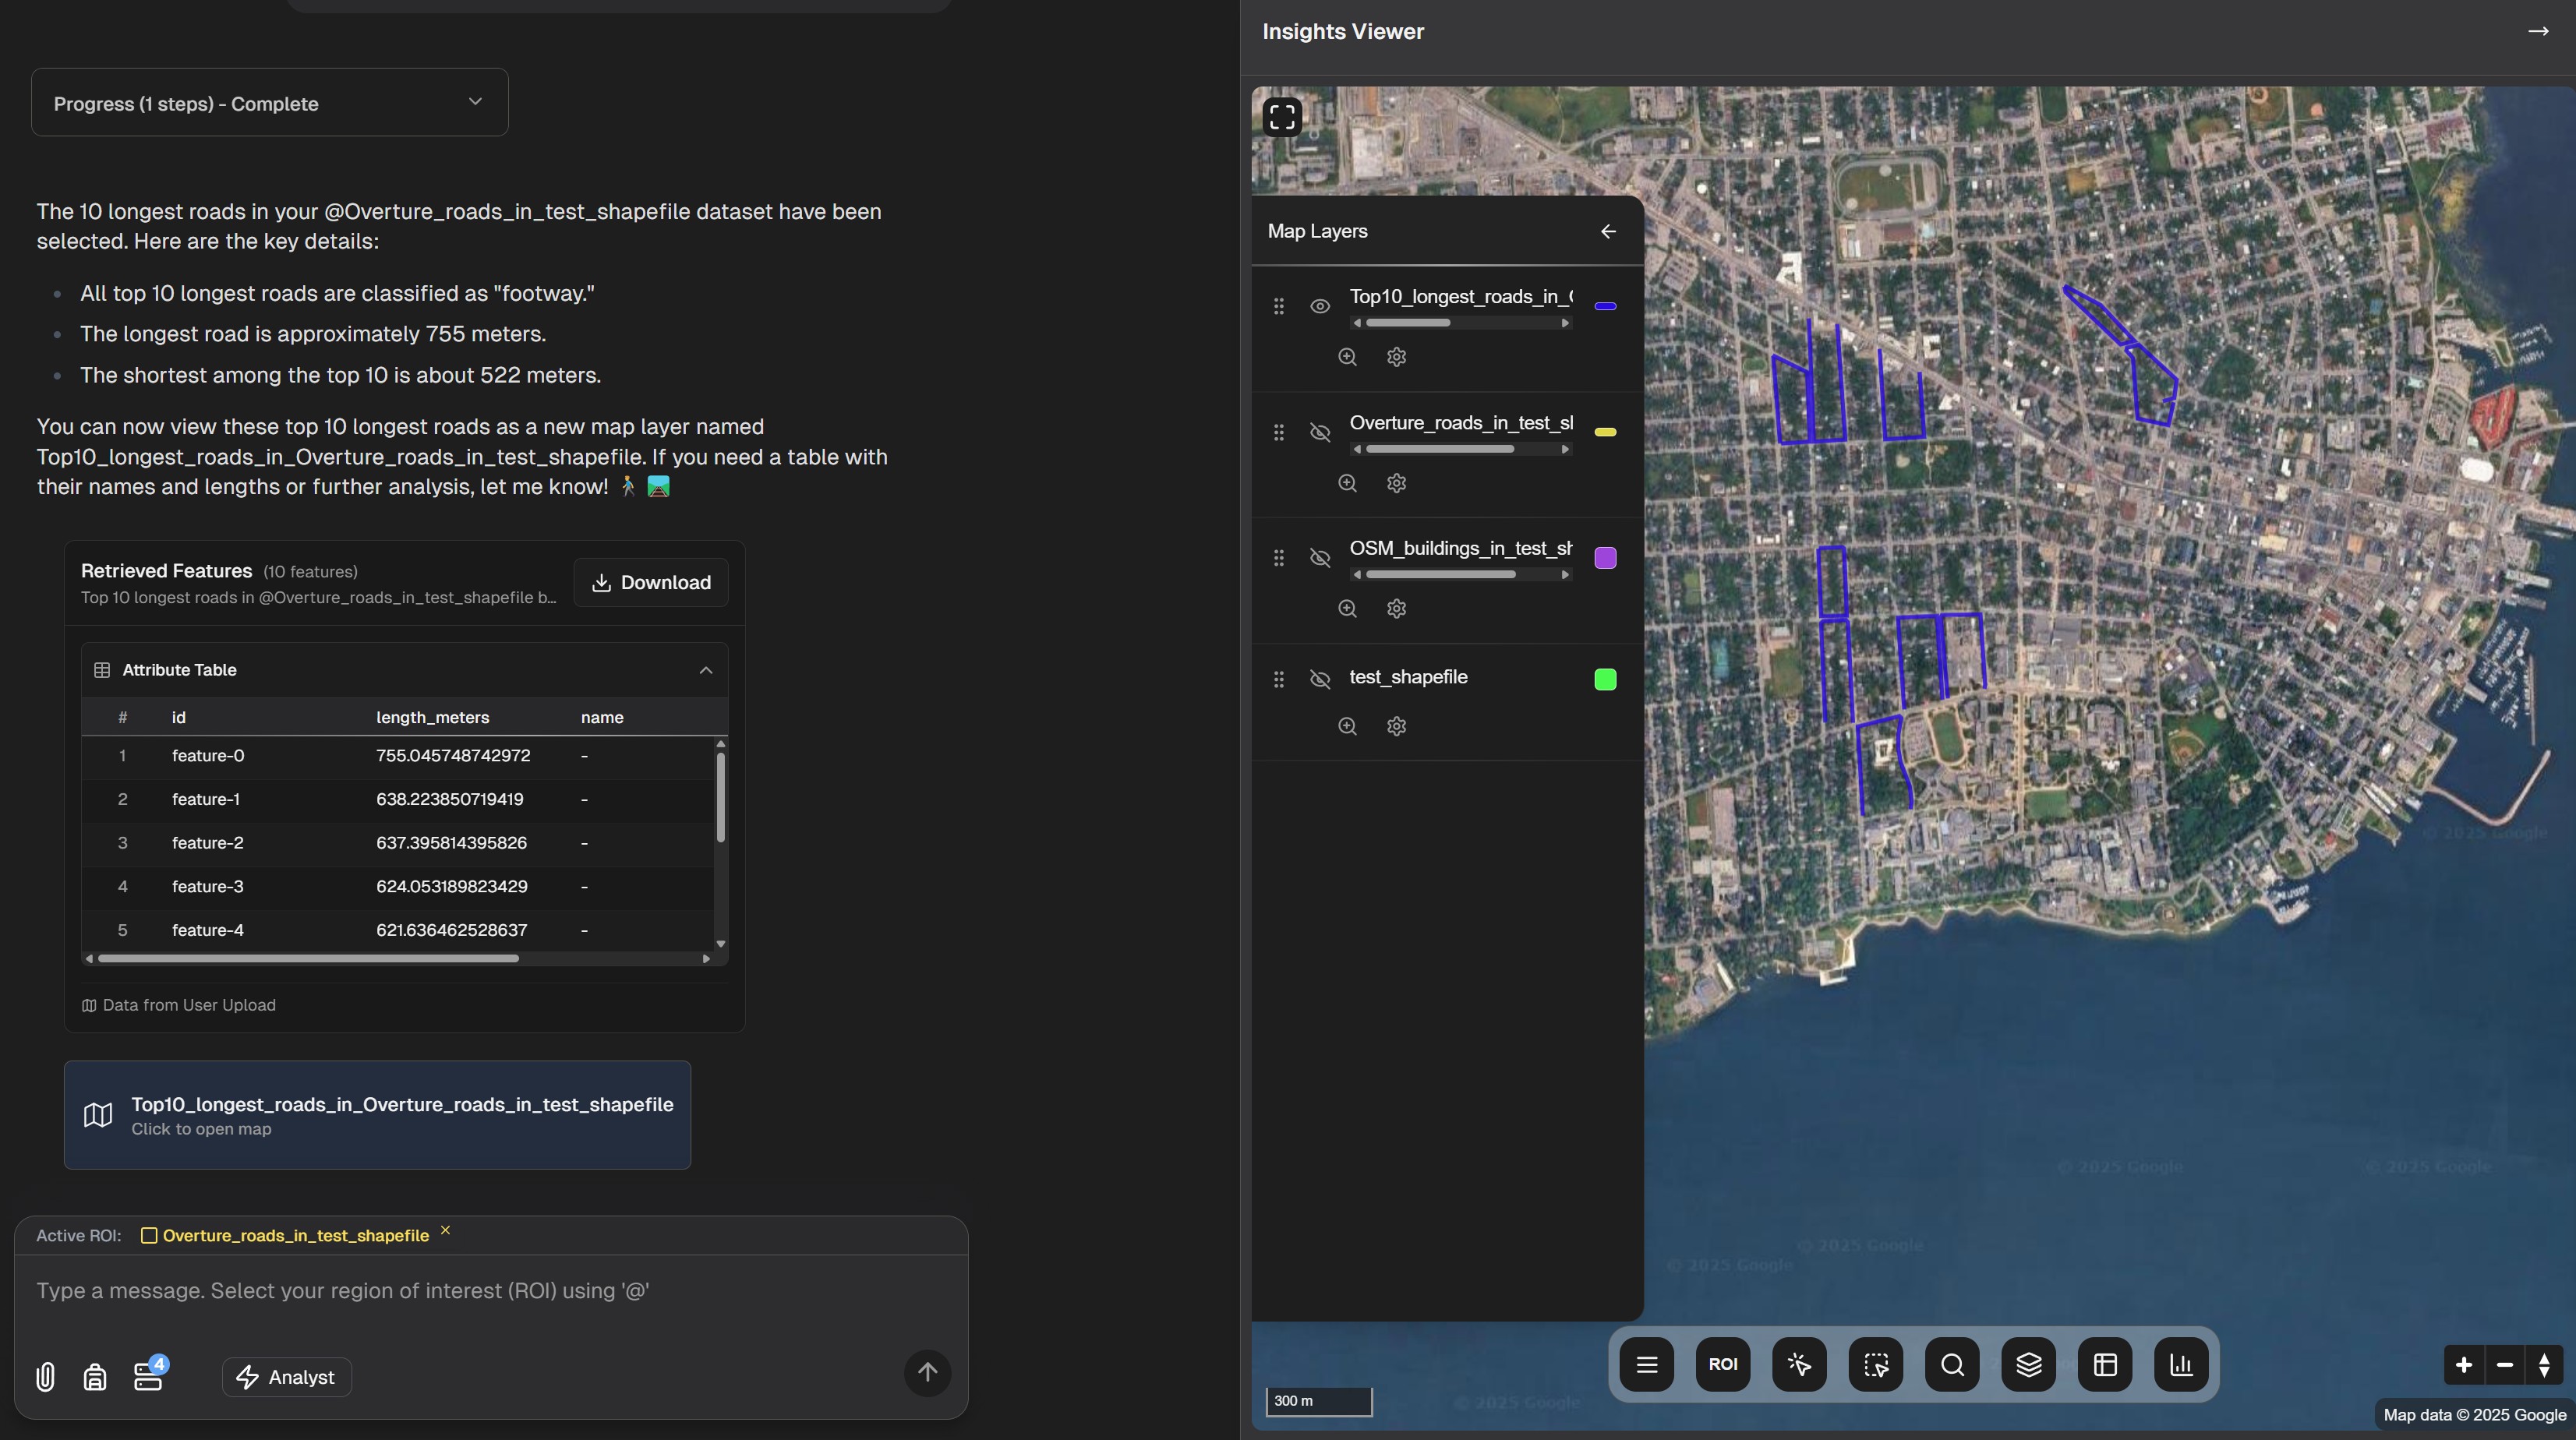
- Query results from one operation can become inputs for subsequent queries
- Refine and narrow your analysis with each step
- Build complex analytical workflows through conversation
Types of Vector Analysis
GeoRetina AI supports several types of vector-based analysis:
Feature Querying
Query specific features based on their attributes and spatial relationships:
- Find all buildings within a specified distance of a point
- Identify roads that intersect with a particular area
- Count features that match specific criteria
Spatial Relationships
Analyze how different features relate to each other in space:
- Determine which points fall within a polygon
- Calculate distances between features
- Identify overlapping areas between different polygons
Demographic Analysis
Combine census data with geographic boundaries:
- Analyze population distribution across regions
- Calculate statistics for specific demographic groups
- Compare demographic metrics between different areas
Working with Vector Data in GeoRetina AI
GeoRetina AI allows you to access various vector data sources:
- Built-in datasets including OpenStreetMap and Overture Maps Foundation data
- User-uploaded data in formats like GeoJSON and Shapefiles
- Custom vector databases that you connect to GeoRetina AI
Example Workflows
1. Querying Public Infrastructure
You can ask questions about public data sources:
Show me all schools within 5km of this point
Count the number of hospitals in this region
Identify the major roads passing through this area
2. Analyzing Custom Data
After uploading your data, you can analyze it with natural language:
Show all properties in my uploaded layer that are larger than 5 acres
Find points in my dataset that are within flood zones
Calculate the total area of agricultural land in my custom layer
3. Creating Query Loops
Build on previous results for deeper analysis:
Of these schools, show me only those with playgrounds
From these properties, identify those within 1km of a transit station
For these buildings, calculate the average distance to the nearest emergency service
Exporting Results
Analysis results can be exported for use in other tools:
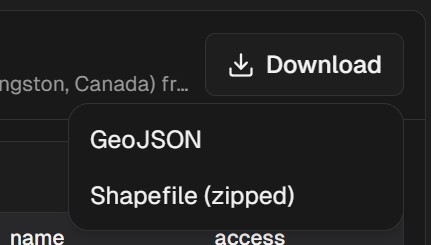
Vector Data Formats
GeoRetina AI supports various vector data formats:
| Format | Support Level | Notes |
|---|---|---|
| GeoJSON | Full | Recommended for web-based applications |
| Shapefile | Full | Industry standard for GIS applications |
Getting Started
To begin using vector-based analysis with GeoRetina AI:
- Define your region of interest using the basic workflow
- Ask natural language questions about vector features in your region
- Refine your queries based on the results
- Explore different analysis types using the navigation menu
The following pages provide detailed instructions for specific types of vector analysis, starting with Public Data Querying and User Data Querying.