GeoRetina

Conservation decisions, backed by evidence.

GeoRetina AI turns geospatial and non-geospatial data into maps, recommendations, and source-backed reports. No GIS workflow required.

No credit card needed

Assess the restoration condition trajectory in test_fields for May through August, comparing 2018–2019 with 2024–2025.

Worked for 3m 37s

I analyzed growing-season vegetation condition across test_fields — located near Grove City in Meeker County, Minnesota — using Sentinel-2 surface reflectance, restricted strictly to the May 1 – August 31 window for each year. I composited 132 scenes with median aggregation and computed two indices: NDVI (Normalized Difference Vegetation Index, a measure of green biomass and chlorophyll activity from the contrast between red and near-infrared reflectance) and EVI (Enhanced Vegetation Index, an optimized variant that reduces soil-background and atmospheric interference and separates dense canopies better).

Baseline vs. recent comparison

PeriodMean NDVIMean EVI
2018–2019 baseline0.640.52
2024–2025 recent0.590.39
Change−0.05−0.13

Year-level detail:

YearMean NDVIMedian NDVIMean EVIMedian EVI
20180.710.740.640.71
20190.560.540.390.36
20240.510.500.330.31
20250.670.690.440.45

The headline result is a moderate decline in period-averaged canopy density: NDVI down 0.05 and EVI down 0.13 between the two windows. But the more important finding is that this difference is not a clean restoration signal in either direction — the within-period spread is larger than the between-period gap. The baseline itself spans a strong 2018 (0.71) and a weak 2019 (0.56), and the recent period spans a weak 2024 (0.51) and a strong 2025 (0.67).

Baseline vs recent growing-season values

00.20.40.60.8NDVI mean, baseline 0.640.64NDVI mean, recent 0.590.59Δ −0.05NDVI meanNDVI median, baseline 0.640.64NDVI median, recent 0.590.59Δ −0.05NDVI medianEVI mean, baseline 0.520.52EVI mean, recent 0.390.39Δ −0.13EVI meanEVI median, baseline 0.530.53EVI median, recent 0.380.38Δ −0.15EVI median
  • Baseline 2018–2019
  • Recent 2024–2025
Baseline vs recent growing-season values: mean and median

The full 2018–2025 trajectory

Because the two-period comparison is sensitive to which years land in each bin, the eight-year record is far more informative. It shows cyclical oscillation, not progressive change: high-vigor seasons in 2020 (NDVI 0.82), 2021 (0.77) and 2023 (0.80) alternate with low seasons in 2019 (0.56), 2022 (0.49) and 2024 (0.51). The fitted long-term trends are slightly negative — NDVI −0.0097 per year and EVI −0.0225 per year — but that slope is small relative to the ±0.3 swings between adjacent years.

Growing-season mean by year, 2018–2025

  • NDVI
  • EVI
BaselineRecent0.20.40.60.82018 NDVI 0.712019 NDVI 0.562020 NDVI 0.822021 NDVI 0.772022 NDVI 0.492023 NDVI 0.802024 NDVI 0.512025 NDVI 0.672018 EVI 0.642019 EVI 0.392020 EVI 0.682021 EVI 0.592022 EVI 0.332023 EVI 0.712024 EVI 0.332025 EVI 0.4420182019202020212022202320242025
Each point is the area-wide mean of that year's growing-season median composite

Viewing each year as a departure from the 2018–2019 baseline makes the alternating pattern clearer, and shows that the recent period contains both one of the weaker years and a near-baseline recovery year.

Vegetation change from 2018–2019 baseline

  • NDVI
  • EVI
  • Weakest years
−0.2−0.100.10.22018 NDVI +0.0752018 EVI +0.12520182019 NDVI −0.0752019 EVI −0.12520192020 NDVI +0.1852020 EVI +0.16520202021 NDVI +0.1352021 EVI +0.07520212022 NDVI −0.1452022 EVI −0.17520222023 NDVI +0.1652023 EVI +0.19520232024 NDVI −0.1252024 EVI −0.18520242025 NDVI +0.0352025 EVI −0.0752025
Annual growing-season mean departure from the 2018–2019 baseline

Distribution and condition classes

Across-ROI statistics for the full composite are NDVI mean 0.67, median 0.69, 25th percentile 0.58, 75th percentile 0.78, with a range of −0.06 to 0.94. Year-to-year, the interquartile spread stays reasonably tight around each year's median, meaning the low years are field-wide dips rather than a few degraded patches dragging the average down.

On the condition classification for the full composite period, 90.19% of pixels fall in the healthy NDVI band and 9.14% in moderate condition, with stressed or bare-soil classes together accounting for under 1% of the area. That is a strong overall condition profile and is difficult to reconcile with a degradation interpretation.

Share of area by condition class

  • NDVI
  • EVI
Share of area-of-interest pixels by condition class

Spatially, the NDVI and EVI composite rasters show where the higher- and lower-vigor zones sit within the parcel.

The EVI layer adds a complementary view, since EVI responds more strongly to canopy structure and is less saturated at high biomass.

An important caveat on framing

You asked about a restoration condition trajectory, and I want to be careful here rather than answer the question as posed. What I measured is growing-season greenness, and the pattern in this parcel does not look like a restoration signal at all — it looks like working cropland. The alternating high/low sequence is the classic signature of crop rotation (for example corn versus soybean, which have very different canopy closure and peak-greenness timing), combined with planting-date and seasonal-rainfall variation. A genuine restoration trajectory would typically show directional, cumulative change; this shows oscillation around a high and stable mean with under 1% of the area in stressed or bare classes.

So two conclusions, stated separately:

  1. On the literal comparison: the recent period averages lower than the baseline (NDVI −0.05, EVI −0.13), and the eight-year fitted slope is mildly negative.
  2. On what that means: this is very likely not evidence of declining condition or failed restoration. Both the baseline and recent windows happen to pair one strong year with one weak year, and the 2025 rebound to NDVI 0.67 after the 2024 low of 0.51 shows the field retains full productive capacity. Two-year endpoints are simply too short a window to separate a management cycle from a trend here.

If restoration assessment is genuinely the goal, I'd flag that greenness alone is a weak proxy — it can't distinguish a restored native plant community from a vigorous corn crop, since both score as “healthy.” Confirming a restoration trajectory would need the planting and management history, and ideally land-cover or species-composition evidence rather than index magnitude.

To validate the interpretation above, it's worth correlating these curves against actual planting schedules, nitrogen application records, and local rainfall for the low years (2019, 2022, 2024). Targeted soil testing and in-season scouting would be useful for any sub-zones that stayed suppressed across multiple weak years — those are the areas where a real, persistent condition problem would show up, as opposed to rotation-driven variation.

Both the NDVI and EVI composites are available as map layers and as downloadable rasters, and pixel-level datasets from the run are archived for deeper spatial review.

Attributions:

  • Data source: USGS Landsat Collection 2 L2 and ESA Sentinel-2 L2A
  • Provider: GeoRetina
  • Time period: May 1 – August 31, each year 2018–2025 (132 scenes, median composites)
  • License: Public Domain (Landsat) / CC-BY-4.0 (Sentinel-2)
  • Citation: USGS Landsat Collection 2 L2; ESA Sentinel-2 L2A.
  • Analysis date: 2026-08-30
Insights Viewer
Satellite image of agricultural fields with an NDVI overlay: red where vegetation is weak, green where it is strongNDVI · test_fields

NDVI (vegetation index)

−0.030.93

500 mImagery ©2026 Google
Seasons on the vegetation scaleEach dot is one growing season, placed by its median NDVI
Weak seasonsStrong seasons2024 median 0.50’242022 median 0.51’222019 median 0.54’192025 median 0.69’252018 median 0.74’182021 median 0.79’212020 median 0.86’202023 median 0.86’23WeakerStronger

Weak and strong seasons sit in two clusters, the signature of a crop rotation.

Condition mix by indexEach square is 1% of the area

NDVI90.19% healthy

EVI76.3% moderate

  • Healthy
  • Moderate
  • Stressed

EVI reads dense canopy more strictly than NDVI, so it rates more of the area moderate.

Ask in plain language. Get actionable insights.

Describe what you need — GeoRetina AI runs the analysis and returns in-depth insights, recommendations, and maps you can act on.

Wildfire susceptibility analysis of the Sierra Nevada, California in the GeoRetina AI Insights ViewerMontreal flood-depth map and building exposure analysis in the GeoRetina AI Insights ViewerVegetation health and stress monitoring of agricultural lands in the GeoRetina AI Insights Viewer

Risk and conservation insight, anywhere on Earth.

Track hazard exposure, environmental change, and conservation opportunities across whole regions — in minutes, not weeks.

Land cover classification for the analyzed region in 2018Land cover classification for the analyzed region in 2019Land cover classification for the analyzed region in 2020Land cover classification for the analyzed region in 2021Land cover classification for the analyzed region in 2022Land cover classification for the analyzed region in 2023Land cover classification for the analyzed region in 2024Land cover classification for the analyzed region in 2025

Run analyses side by side. Get an email when each one is done.

Start several analyses at once or schedule them for later. They run in the background while you work on something else.

  • Parallel runsQueue a whole watershed's worth of analyses together.
  • Scheduled runsSet a task to start at a time that suits you.
  • Email when doneEach finished task sends you a link to its results.

Illustration: two analyses running in parallel and a completed one sending an email notification.

Deep insights and clear recommendations.

Analyze

AI Data Analyst

Run risk and conservation analyses on demand and get the findings — and what to do next — explained in plain language.

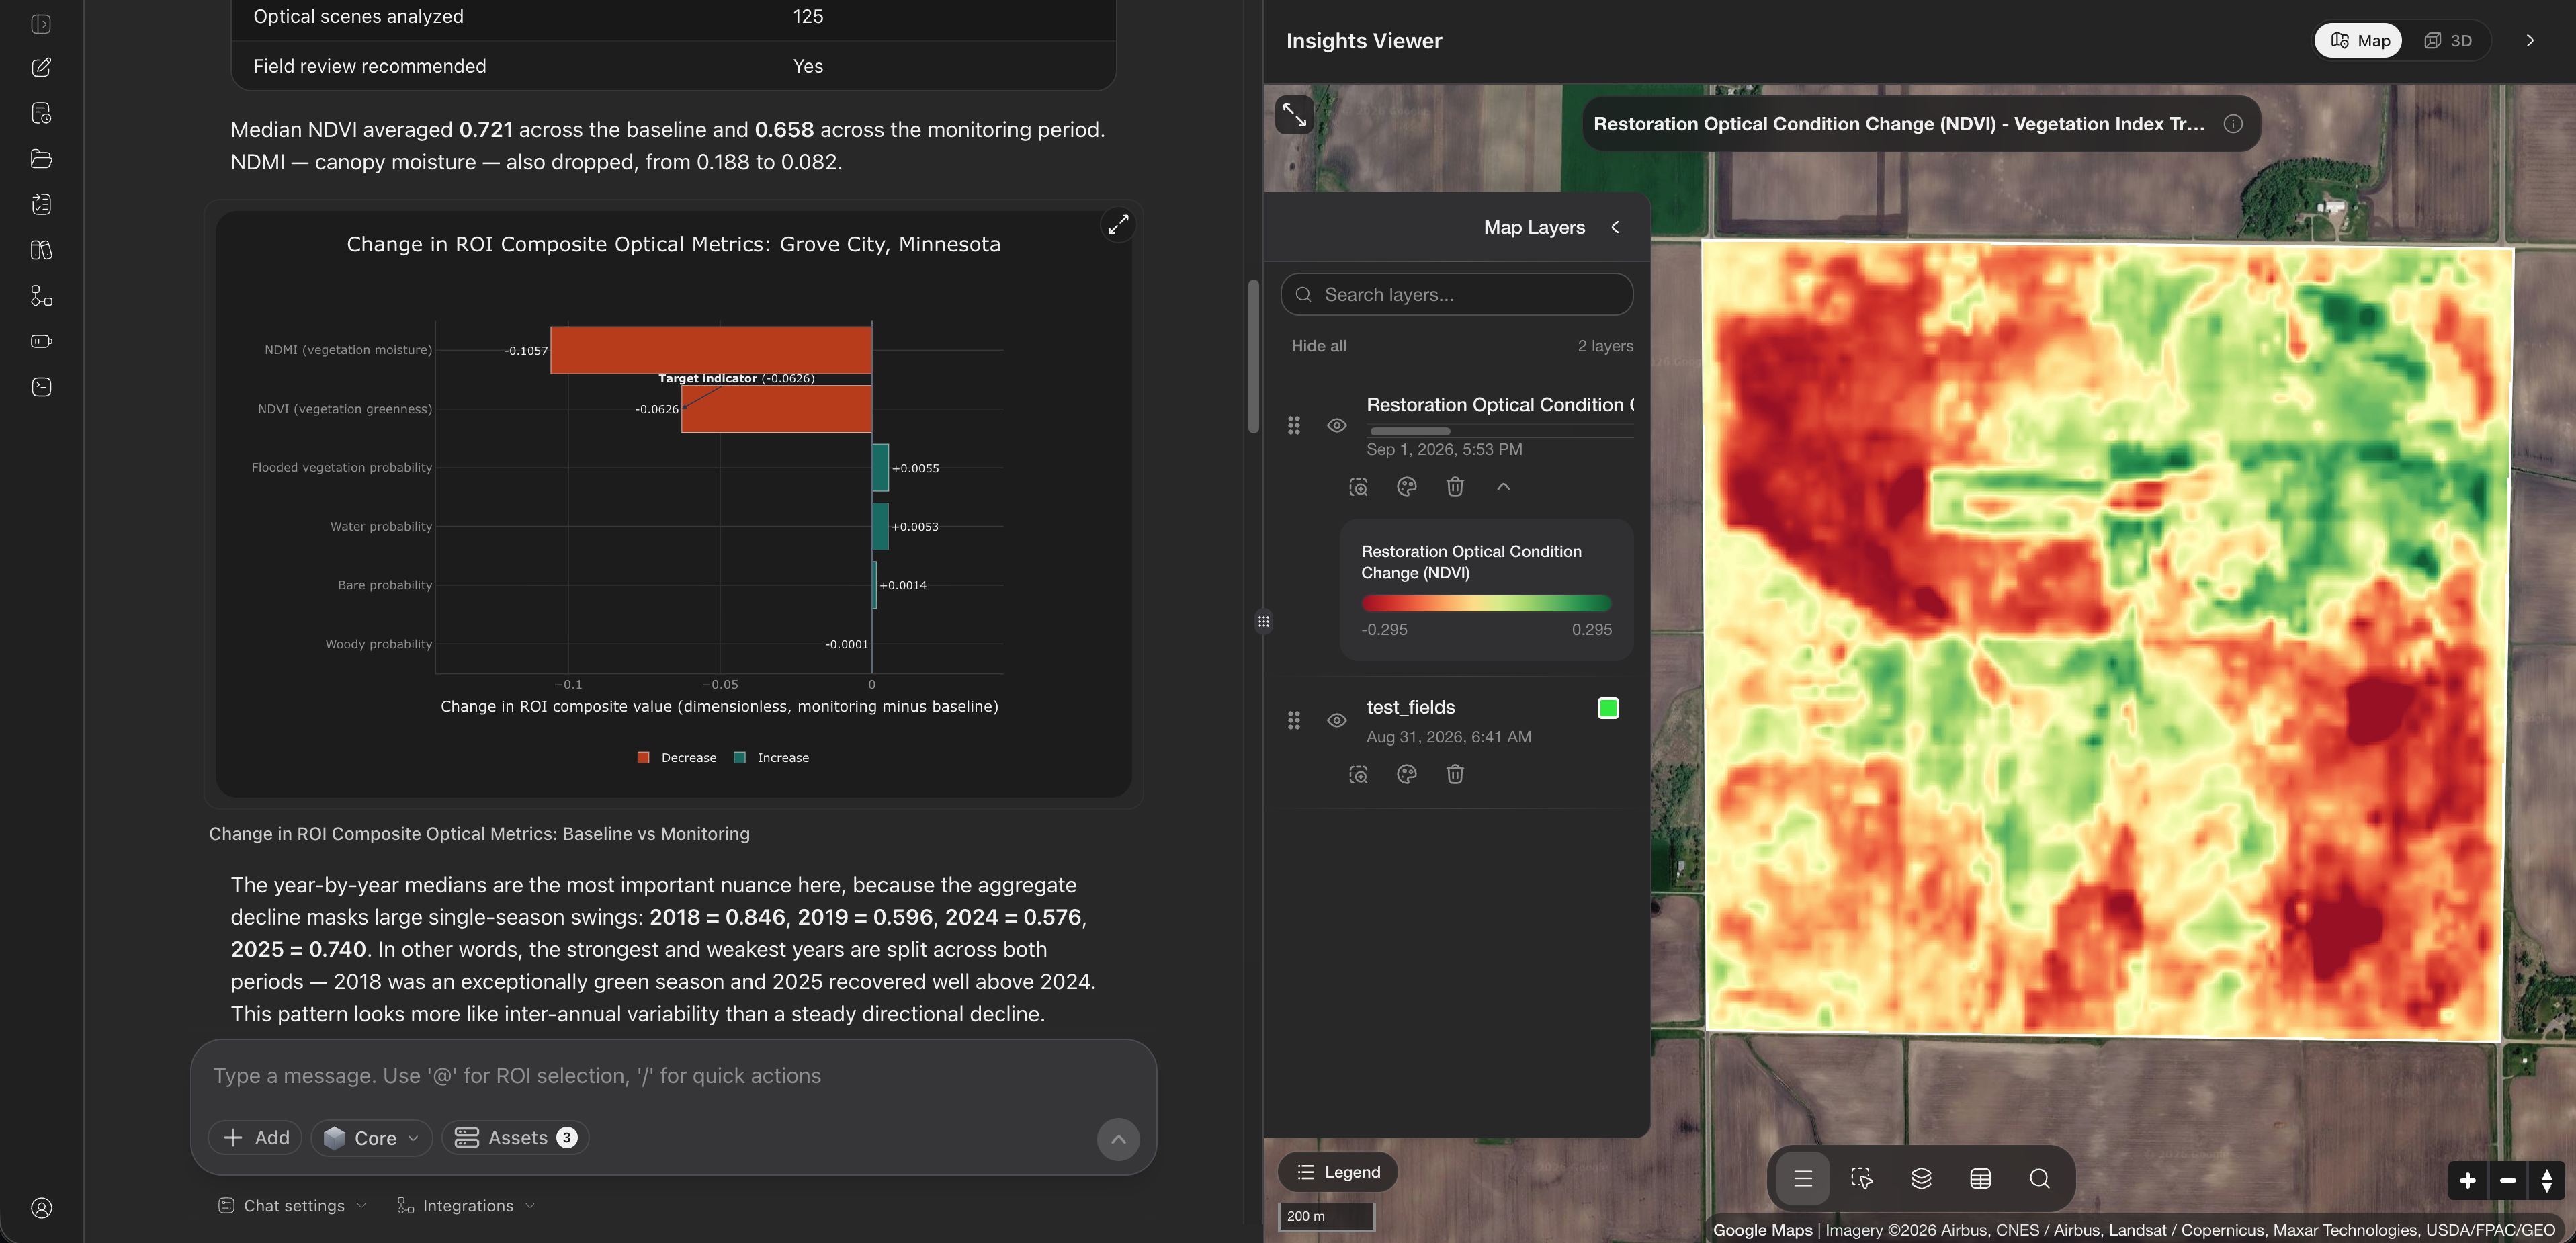
GeoRetina AI restoration condition trajectory with an optical-metric change chart and an NDVI change map
Compose

AI Report Composer

An AI agent turns your findings into a polished, decision-ready presentation or report — ready to share with stakeholders in minutes.

See climate risk in three dimensions.

Flood depth and urban heat as immersive 3D scenes — revealing the exposure that flat 2D maps can't.

3D flood simulation showing water depth across an urban area3D model of the urban heat island effect across a city

Flood simulation. Simulated flood water depth across the built environment. See exactly which blocks and assets are exposed.

Export to wherever you work.

Send analysis results straight to ArcGIS, Google Drive, or OneDrive — or download them locally as standard geospatial files. Your insights, in your stack.

Export results

Choose a destination

Export to Esri ArcGIS

Share read-only copy

Securely share your analyses and chats

Recipients
teammate@georetina.comAdd another…
Share content
ChatsMaps
Allow copying
Expiration— optional
yyyy-mm-dd, --:-- --
Create share

Share insights with your whole team.

Send a read-only copy of any analysis to teammates or clients. Choose what's included — chats, maps, or both — let recipients copy it into their own workspace, and set it to expire whenever you like.

Build on the GeoRetina AI API.

Bring AI-powered geospatial analysis into your own apps and workflows — self-serve with an API key, embed it in your product to serve your own end users, or run it entirely in your own environment.

For developers

API Keys

Generate a key and start calling the GeoRetina AI API in minutes. Drop geospatial analysis straight into your apps, models, and pipelines.

For platforms

Organizations

Embed GeoRetina AI in your own app and provision your end users through the API — each one gets their own private workspace, just as if they'd signed up directly.

For regulated teams

Self-hosted

Deploy GeoRetina AI in your own cloud or on-prem, keeping your data and compute fully under your control.

Enterprise-grade security and privacy.

Your data is protected end to end — encrypted, access-controlled, and never used to train our models.

Data protection

Encrypted in transit & at rest

All data is encrypted in transit with TLS and at rest with AES-256.

Privacy

Your data stays yours

We never train our models on your data. You control what is retained and what is deleted.

Identity

SSO & access control

Single sign-on, role-based permissions, and organization-managed accounts.

Deployment

Self-hosting & data residency

Deploy GeoRetina AI in your own cloud or region to keep data and compute under your control.

Visibility

Audit & monitoring

Access and activity are logged, with audit trails available for review.

Reliability

Hardened infrastructure

Built on continuously patched, access-controlled cloud infrastructure.

Plans

Essentials

14-day free trial
$69/ month

Essential GeoRetina AI access for individual geospatial workflows.

Try for free
Features
  • 50 analysis credits / month
  • 100 AI messages / month
  • 1 GB storage
  • 10 projects
  • Core and Advanced agents
  • 50 km² max AOI
  • Email support
Most Popular

Pro

$169/ month

Expanded credit allowance for recurring professional workflows.

Subscribe
Features
  • 200 analysis credits / month
  • 300 AI messages / month
  • 10 GB storage
  • 50 projects
  • 250 km² max AOI
  • Advanced agents and reporting
  • Advanced Knowledge Base
  • Priority email support

Enterprise

Let's talk

Custom terms for teams that need managed onboarding.

Contact sales
Features
  • Everything in Pro
  • API access for user provisioning and licensing
  • Custom analysis credits and AI messages
  • Custom storage and analysis areas
  • Procurement and invoicing support
  • Premium support and SLA options

Need more? Purchase additional credits to exceed plan limits. Contact us for more information.

Frequently Asked Questions

GeoRetina AI is an AI platform for climate risk and conservation decisions. Describe what you need in plain language — flood and wildfire exposure, vegetation and crop health, land-cover change, or conservation opportunities — and it runs the geospatial analysis and returns maps, charts, and explanations. No GIS or coding expertise required.

Common workflows include climate and flood risk mapping, wildfire susceptibility, vegetation and crop-health monitoring, land-cover and land-use change, forest-loss and driver attribution, and conservation and habitat screening — across whole regions or individual parcels and fields.

GeoRetina AI is decision-support: every result is shown on the map with the underlying layers, charts, and a written explanation, so you can inspect the evidence rather than trust a single number. Accuracy depends on the input data and the analysis, and screening or prioritization outputs are meant to focus attention — not to replace field verification or engineering review where that is required.

Globally. You can analyze any region on Earth — from a single parcel or field to entire watersheds and regions — subject to the satellite, climate, and reference data available for that area. You can also bring your own datasets to extend coverage for supported analyses.

Teams making environmental and risk decisions — conservation organizations, government and planning agencies, insurers and risk teams, agricultural and forestry operators, and consultancies — who need spatial evidence without running a GIS stack themselves.

Yes. Send results straight to Esri ArcGIS, Google Drive, or OneDrive, or download them locally as standard geospatial files. You can also build on the GeoRetina AI API to bring analysis into your own apps and workflows.

Yes. Data is encrypted in transit and at rest, access is controlled with single sign-on and role-based permissions, and we never train our models on your data. For regulated teams, GeoRetina AI can be self-hosted in your own cloud or region.

Yes — you can start for free, no credit card required. See pricing for plan details, included credits, and options for teams and enterprises.

Credits are computation units consumed each time you run an analysis. Usage scales with the size of the area of interest, the complexity of the workflow, and the depth of the insights — a single-date land-cover map over a small area uses far fewer credits than a multi-year trend analysis across a region. Each plan includes a monthly credit allowance, and you can purchase more when needed.

Sign in to the hosted platform here: GeoRetina AI sign in.

If you are new to GeoRetina AI, start with the basic workflow guide. It walks through selecting a region of interest, running your first prompt, and reviewing results.

Support is included with every subscription. Essentials plans include email support, Pro plans include priority email support for faster response times, and Enterprise plans include premium support with SLA options for guaranteed response commitments.

Get Started