Getting Started with GeoRetina AI
This guide will walk you through the basic workflow of using GeoRetina AI for your first geospatial analysis.
The GeoRetina AI Interface
When you first access GeoRetina AI, you'll be presented with the chat interface where you can interact with the AI assistant.
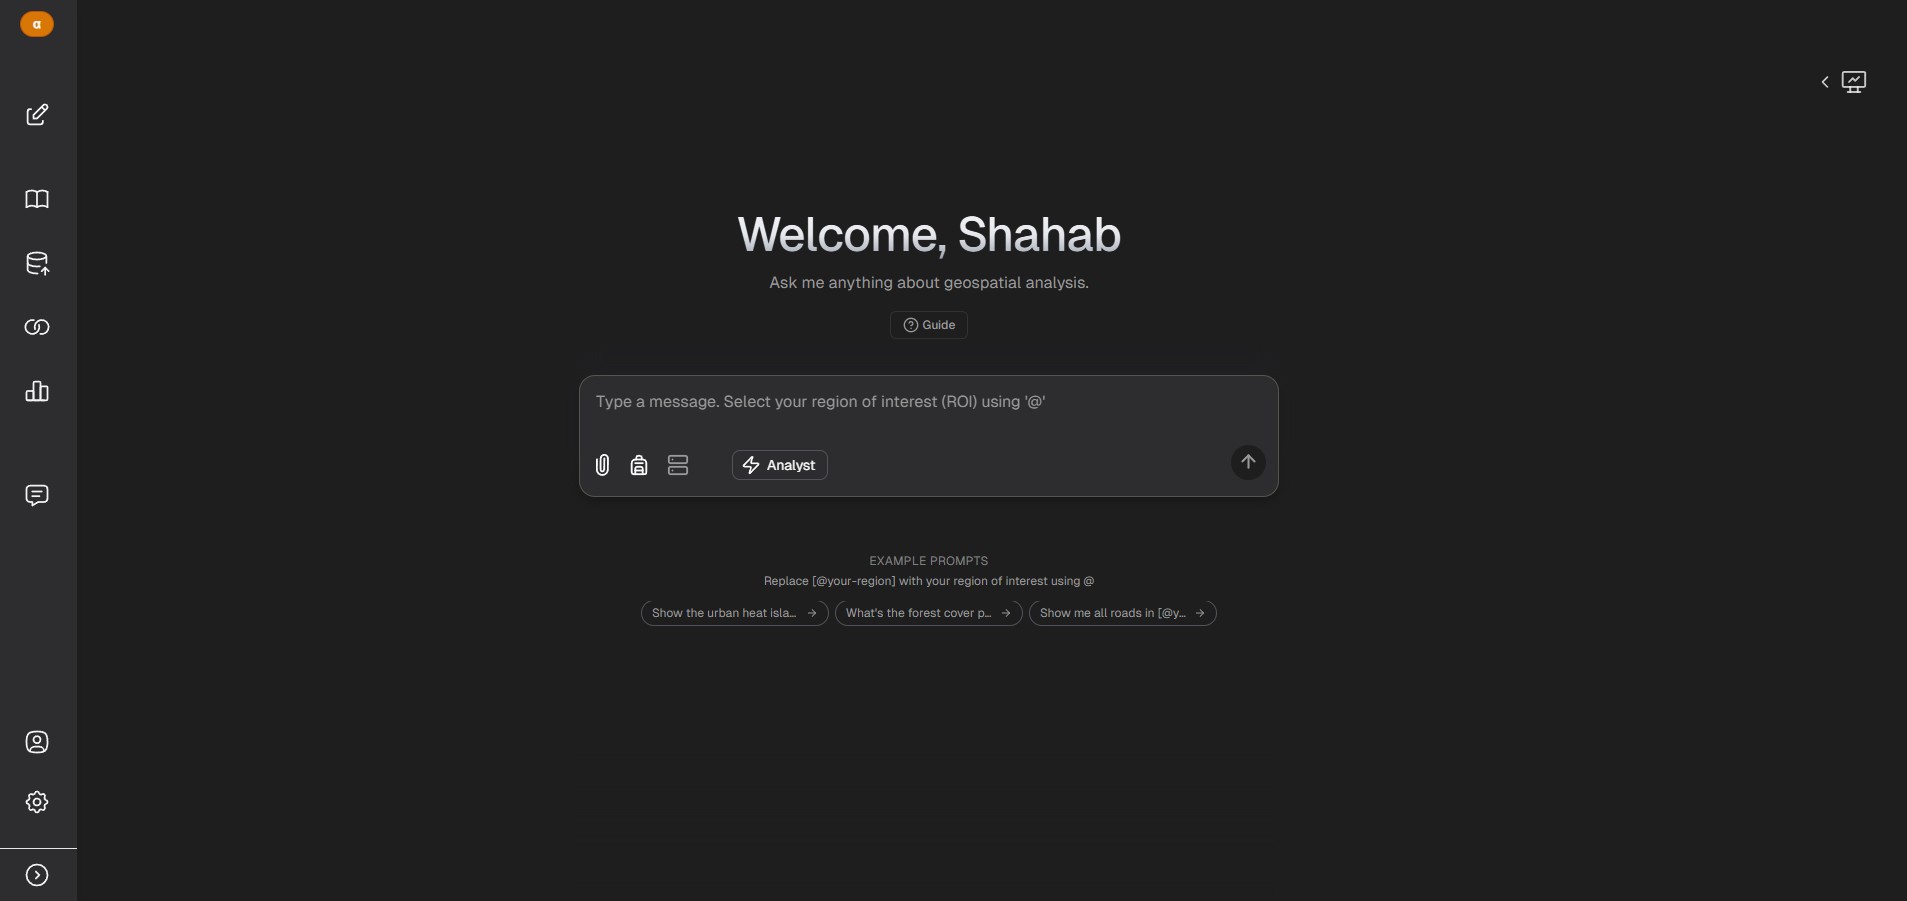
The interface includes several key components:
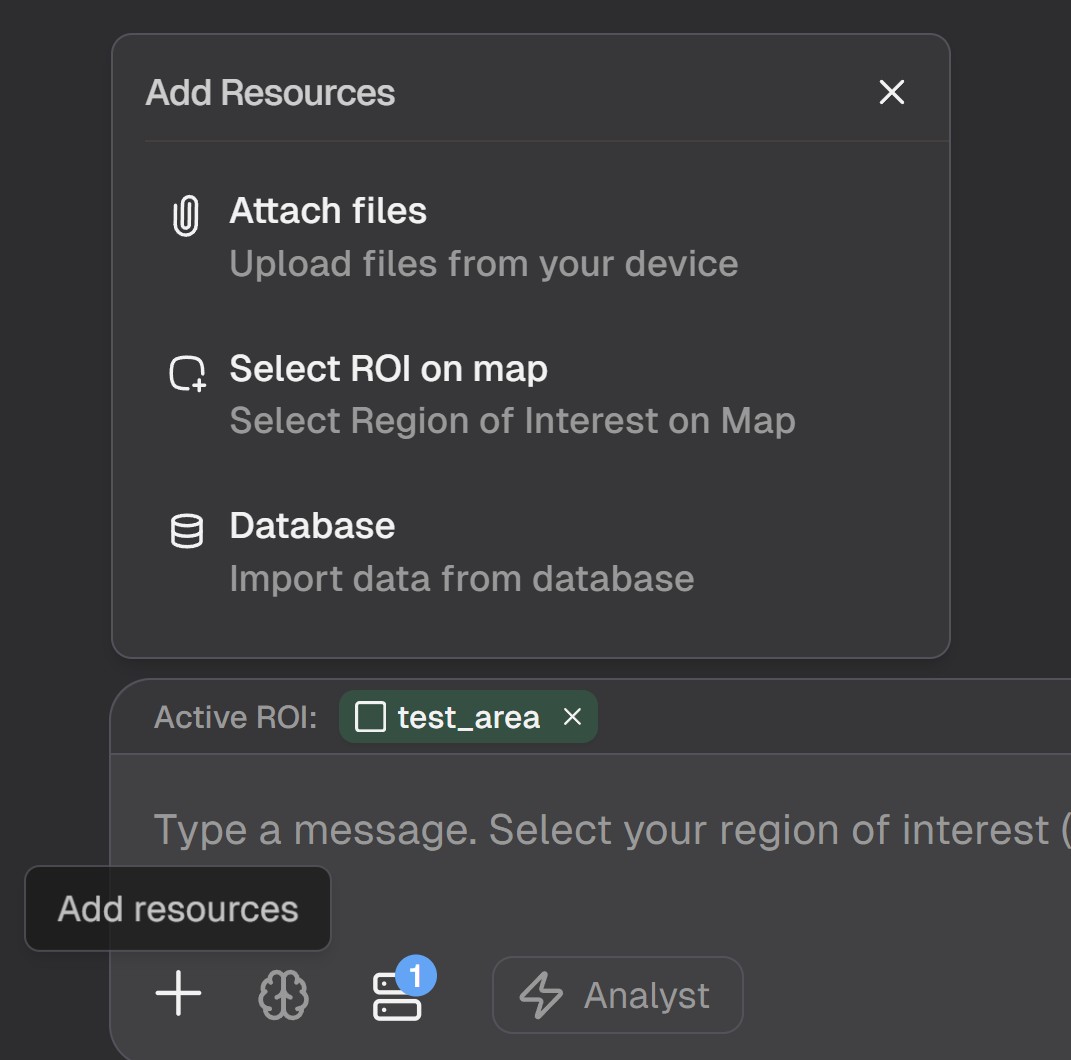
- Add Resources: Contains tools for attaching files, connecting databases, and adding regions of interest (ROI)
- Chat Area: Where you communicate with the AI
- Map View: Displays geographic data and results
Basic Workflow
1. Select a Region of Interest (ROI)
Before performing analysis, you need to define the geographic area you want to analyze:
-
Click the "Add Resources" button and select "Add ROI" from the menu
-
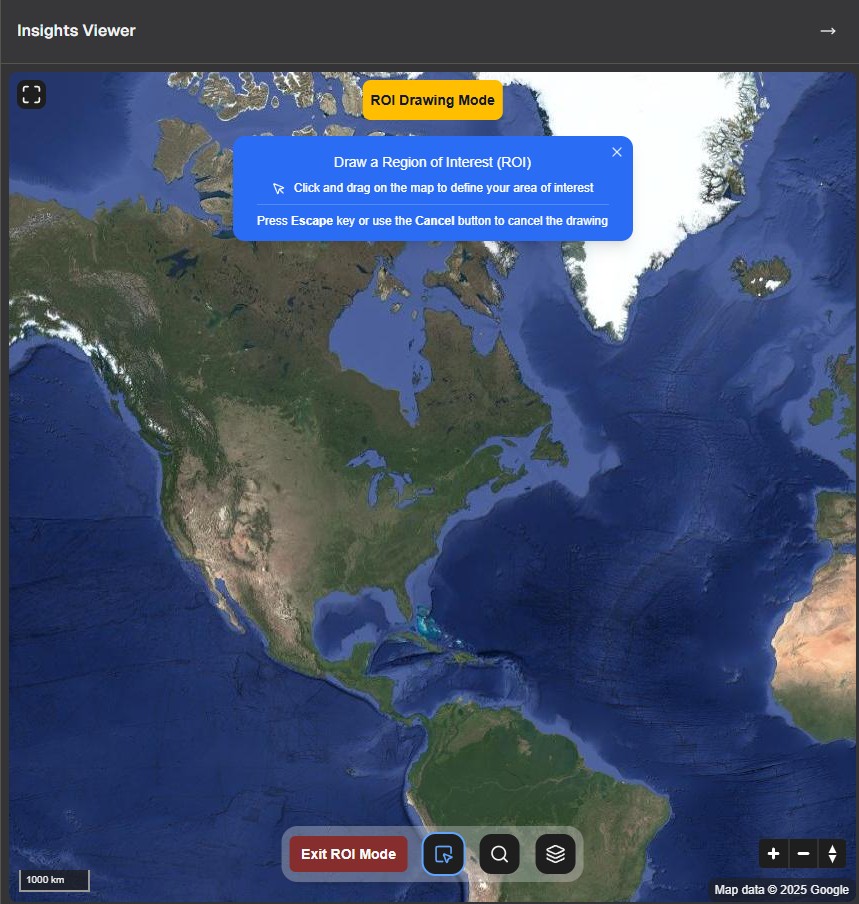
When you click the button, the map is opened where you can select an area to run analyses within it
-
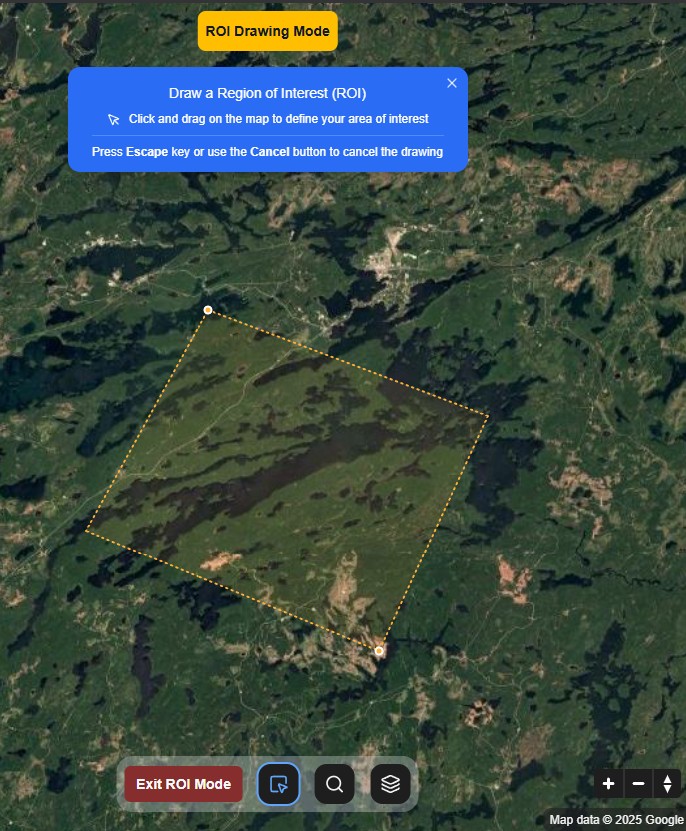
Use the drawing tools to define your area

-
Draw your region of interest on the map
-
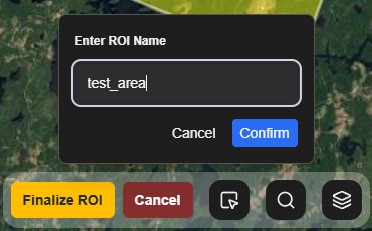
Complete your drawing by double left-clicking on the last vertex. The dashed sides of the polygon will turn into solid yellow lines, indicating that the ROI is ready for finalizing.
-
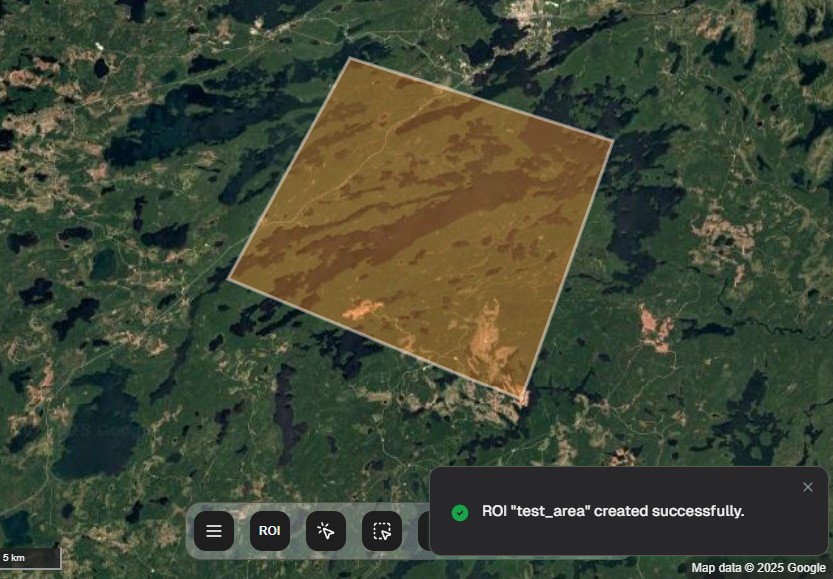
Finalize your selection
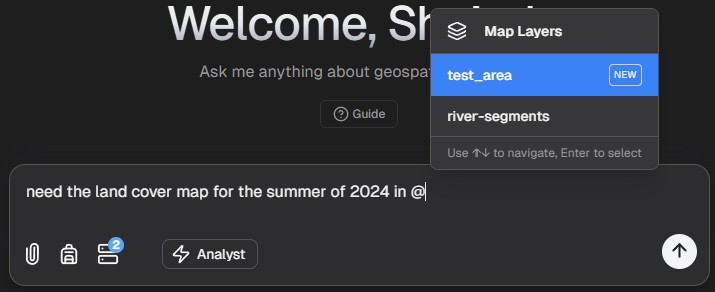
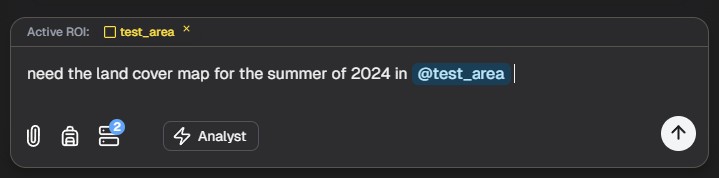
2. Ask Your Question
Once your ROI is defined, you can ask the AI to perform an analysis:
-
Type your question or request in the chat box
-
The AI will process your request and may ask for clarification
3. View Results
After processing, GeoRetina AI will display results directly on the map:
-
Results appear in the map view
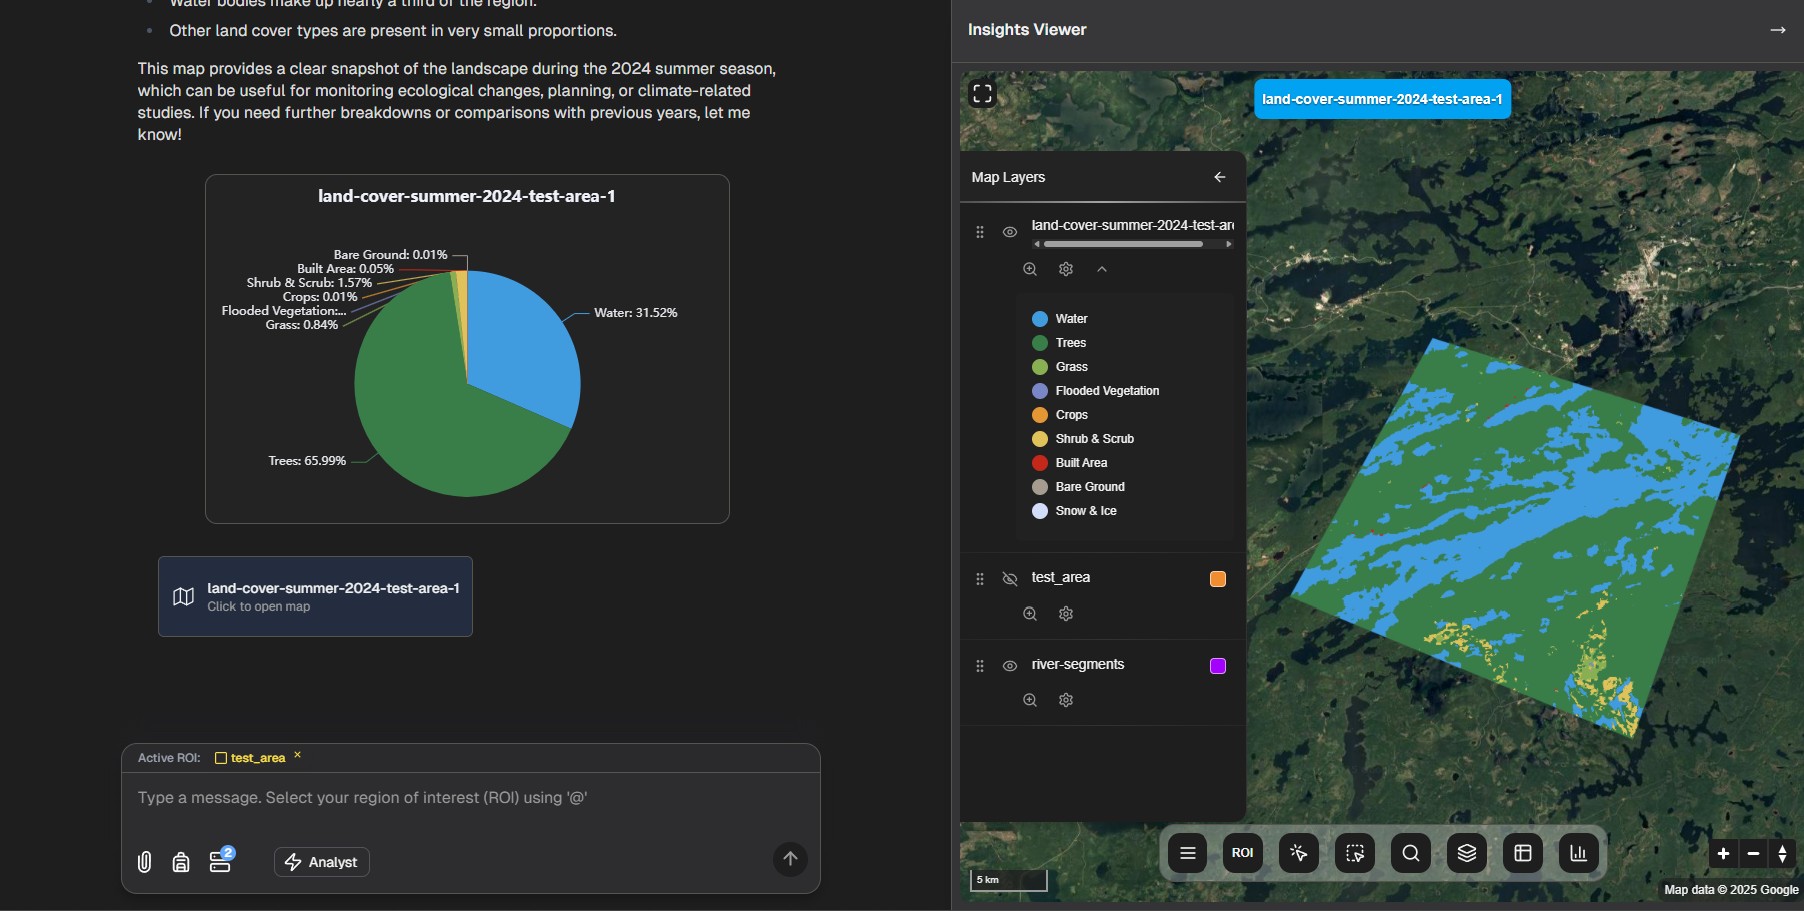
-
You can view additional insights by clicking the insights viewer button on the right side of the chat page

-
The insights viewer provides detailed information about your analysis
4. Interactive Raster Querying
After completing a raster analysis, you can extract detailed information from specific locations or areas by interactively querying the results directly on the map.
Query Tools
GeoRetina AI provides intuitive querying tools accessible through the task bar:
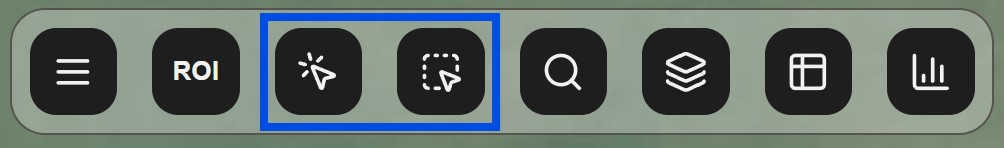
- Point Querying: Click any location on the raster map to extract pixel values at that specific coordinate
- Polygon Querying: Draw custom areas to analyze statistics and patterns within defined regions
Query Results and Visualization
When you perform a point query, GeoRetina AI automatically generates detailed charts and analytics:
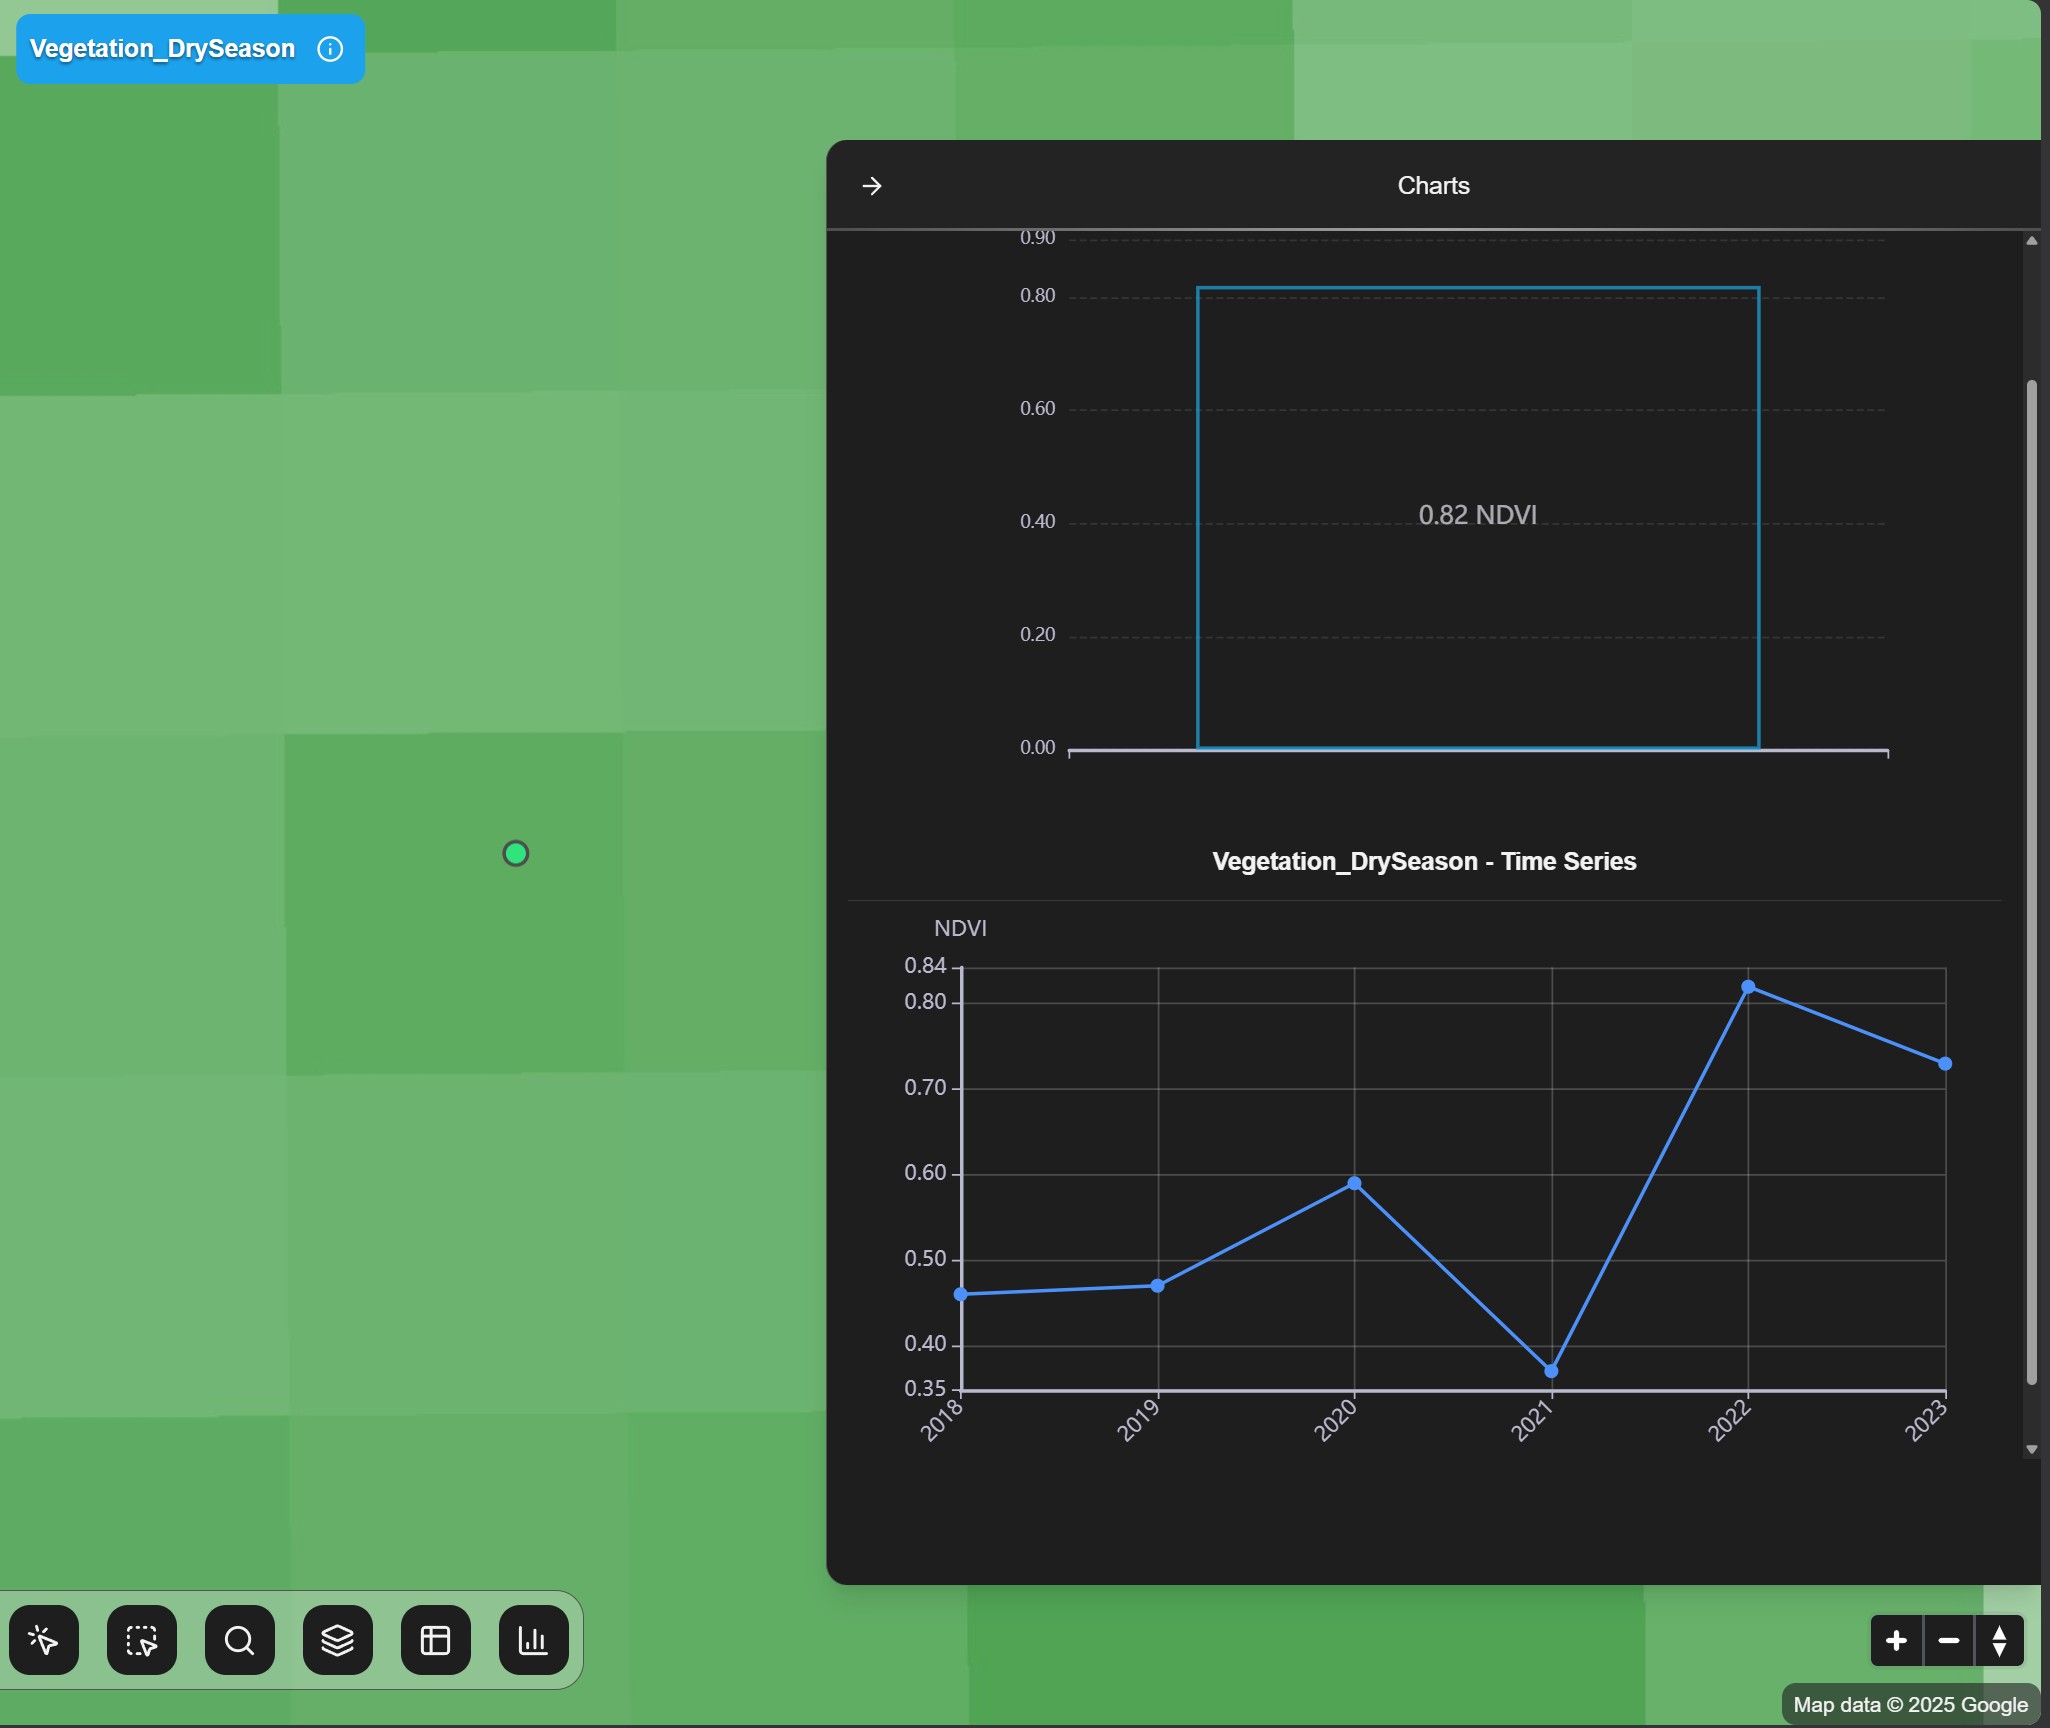
The query results provide:
- Exact pixel values at the queried location or area
- Statistical summaries for polygon queries (mean, min, max, standard deviation)
- Time series charts for temporal analysis
- Interactive visualizations to explore data patterns
- Downloadable data for further analysis
This interactive querying capability makes it easy to extract actionable insights from complex raster analyses without requiring specialized GIS knowledge.
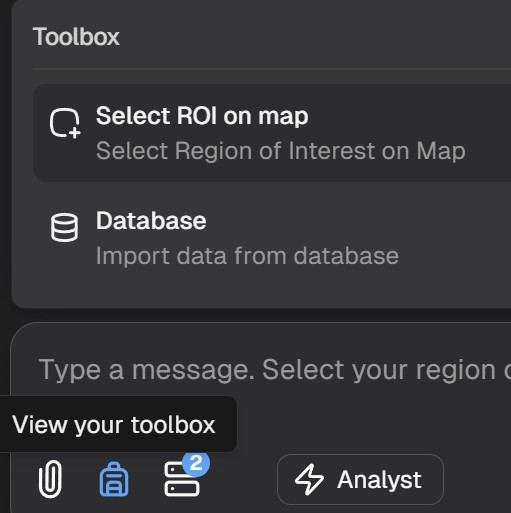
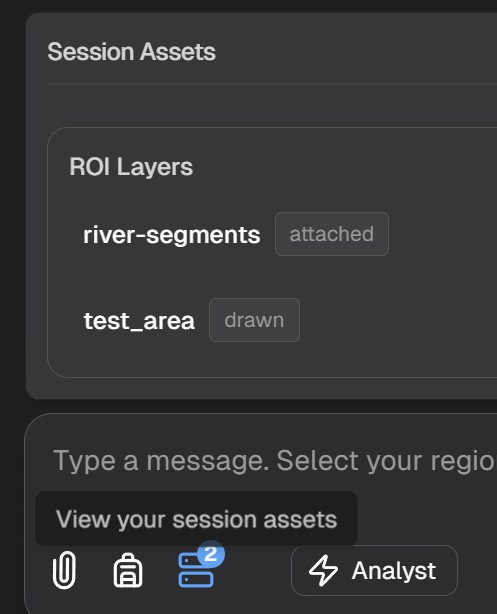
5. Session Assets
GeoRetina AI saves your analysis results for future reference:
- Access previous analyses and results in the Session Assets panel
Next Steps
Now that you understand the basic workflow, you can explore specific types of geospatial analysis:
Raster-Based Analysis
- Land Use/Land Cover Mapping - Classify Earth's surface into different categories
- Urban Heat Island Analysis - Analyze temperature variations in urban areas
- Vegetation Monitoring - Track plant health and growth patterns
- Air Pollution Analysis - Monitor atmospheric pollutants
Vector-Based Analysis
- Public Data Querying - Query OpenStreetMap and other public datasets
- Custom Data Upload - Analyze your own geospatial data
- Query Loops - Build complex multi-step analyses