Land Use/Land Cover Mapping
Land Use/Land Cover (LULC) mapping is one of the foundational raster analysis capabilities of GeoRetina AI. This guide demonstrates how to perform LULC analysis using Google's Dynamic World dataset.
What is LULC Mapping?
Land Use/Land Cover mapping classifies Earth's surface into different categories based on satellite imagery. These categories typically include:
- Water
- Trees/Forests
- Grass/Shrubs
- Crops/Agriculture
- Built-up areas/Urban
- Bare ground
- Snow/Ice
LULC maps help understand environmental changes, urban growth, deforestation, and other critical landscape dynamics.
Using GeoRetina AI for LULC Analysis
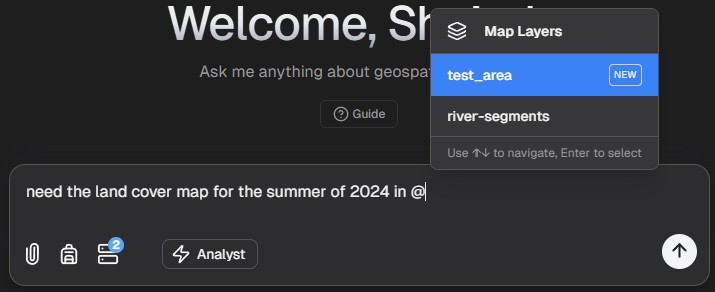
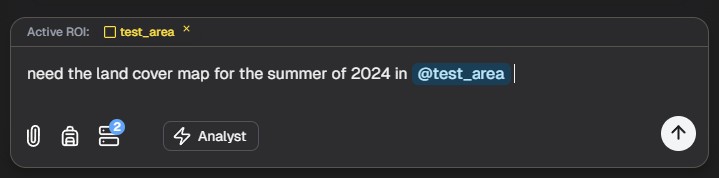
1. Define Your Region and Time Period
After selecting your ROI, you can request a LULC analysis by specifying the time period.
For example, you might ask:
Generate a land use/land cover map for this region for summer 2024.
2. Refine Your Query
GeoRetina AI may ask you to clarify or provide additional parameters:
- Specific date range
- Resolution level
- Particular land cover types of interest
3. Analyzing LULC Results
Once processed, GeoRetina AI will display your LULC map directly on the interface:
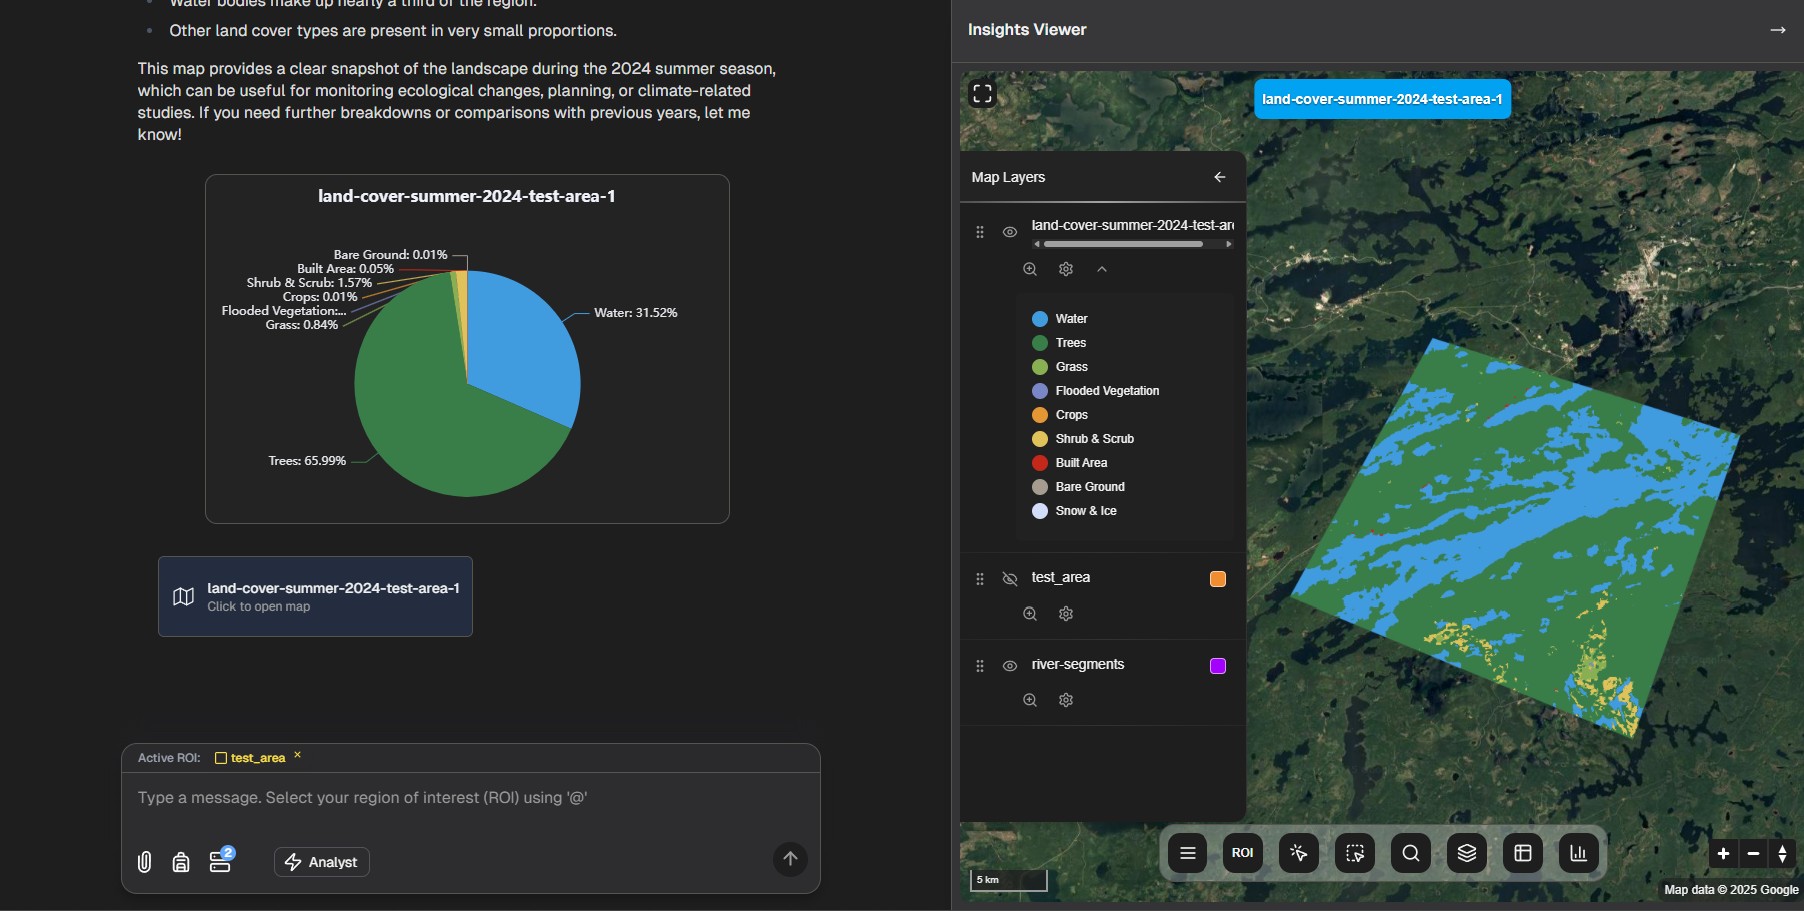
The map is color-coded according to the Dynamic World classification system:
| Land Cover Type | Color |
|---|---|
| Water | Blue |
| Trees | Dark Green |
| Grass | Light Green |
| Flooded Vegetation | Teal |
| Crops | Yellow |
| Shrub & Scrub | Beige |
| Built Area | Red |
| Bare Ground | Brown |
| Snow & Ice | White |
4. Additional Analysis
GeoRetina AI allows you to go beyond basic visualization with additional analytical capabilities:
- Calculate area percentages for each land cover type
- Compare LULC changes between different time periods
- Identify specific patterns (e.g., urban expansion, deforestation)
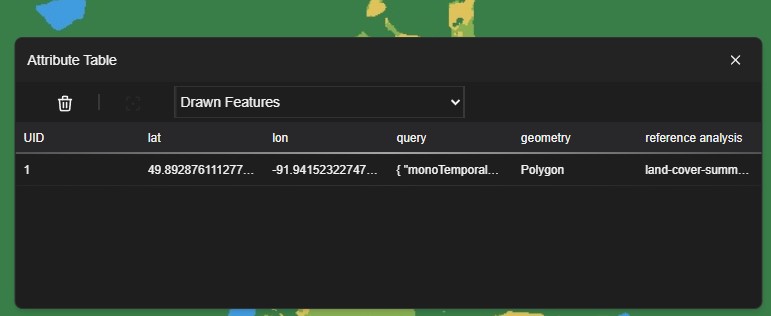
- Export results for use in external applications
Examples of LULC Applications
- Urban Planning: Identify development patterns and available green space
- Conservation: Monitor protected areas and detect encroachment
- Agriculture: Assess crop distributions and health
- Climate Research: Track changes in forests, wetlands, and other carbon sinks
- Disaster Response: Map affected areas after floods, fires, or other events
Next Steps
After mastering LULC analysis, consider exploring: