Raster Follow-up
Raster Follow-up is an experimental feature. It is currently under active development and may experience bugs and data persistency problems due to the nature and state of the analysis. Its functionality and interface may change.
Raster Follow-up is a new capability in GeoRetina AI that allows you to ask more detailed, specific questions after you get the results of a raster-based analysis. This feature enables deeper exploration of your analysis results through context-aware follow-up questions.
Overview
With Raster Follow-up, you can continue exploring your geospatial analyses beyond the initial results. Whether you're examining vegetation trends, forecasting weather, or analyzing urban heat islands, you can now dive deeper into your data with targeted questions.
Key Benefits
Deeper Analysis: Keep asking more specific questions about your analysis results
Beyond Default Stats: Explore patterns, trends, and details that matter most to you
Time Saving: Spend less time manually analyzing results to gain insights
Supported Analysis Types
Raster Follow-up currently works with the following geospatial analyses:
- Land Cover & Land Use Mapping
- Urban Heat Island Analysis
Note: More analysis types will be supported in future releases.
How It Works
Step 1: Enable Follow-up During Analysis
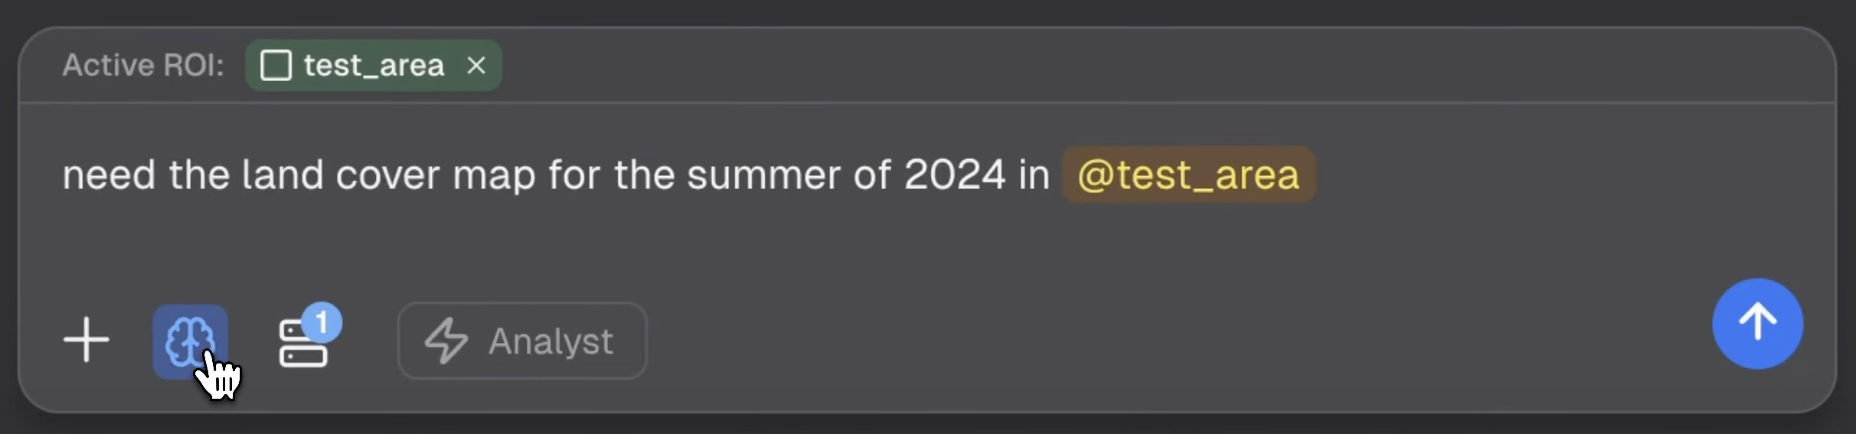
When running a raster analysis, you'll see a Follow-up button in the chat input box. Click this button to enable the feature for your analysis.

Just like when requesting a raster analysis normally, users need to enable the "Raster Follow-up" button to unlock the ability to ask context-aware, in-depth questions about their analysis results:
Step 2: Wait for Analysis Completion
Once you've enabled Follow-up, the system will prepare your analysis data for interactive querying. You'll see a progress indicator showing when the feature is ready.

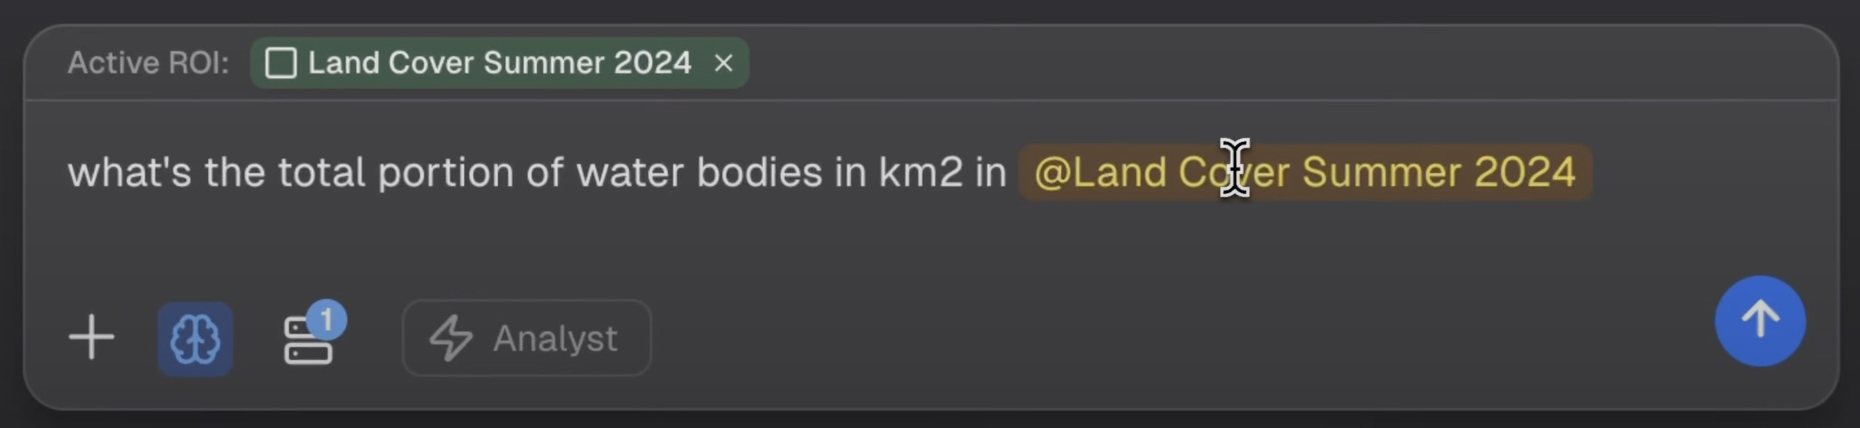
Step 3: Ask Follow-up Questions
After your analysis is complete and the Follow-up feature is ready, you can start asking detailed questions about your results. The system understands the context of your analysis and can provide specific insights.
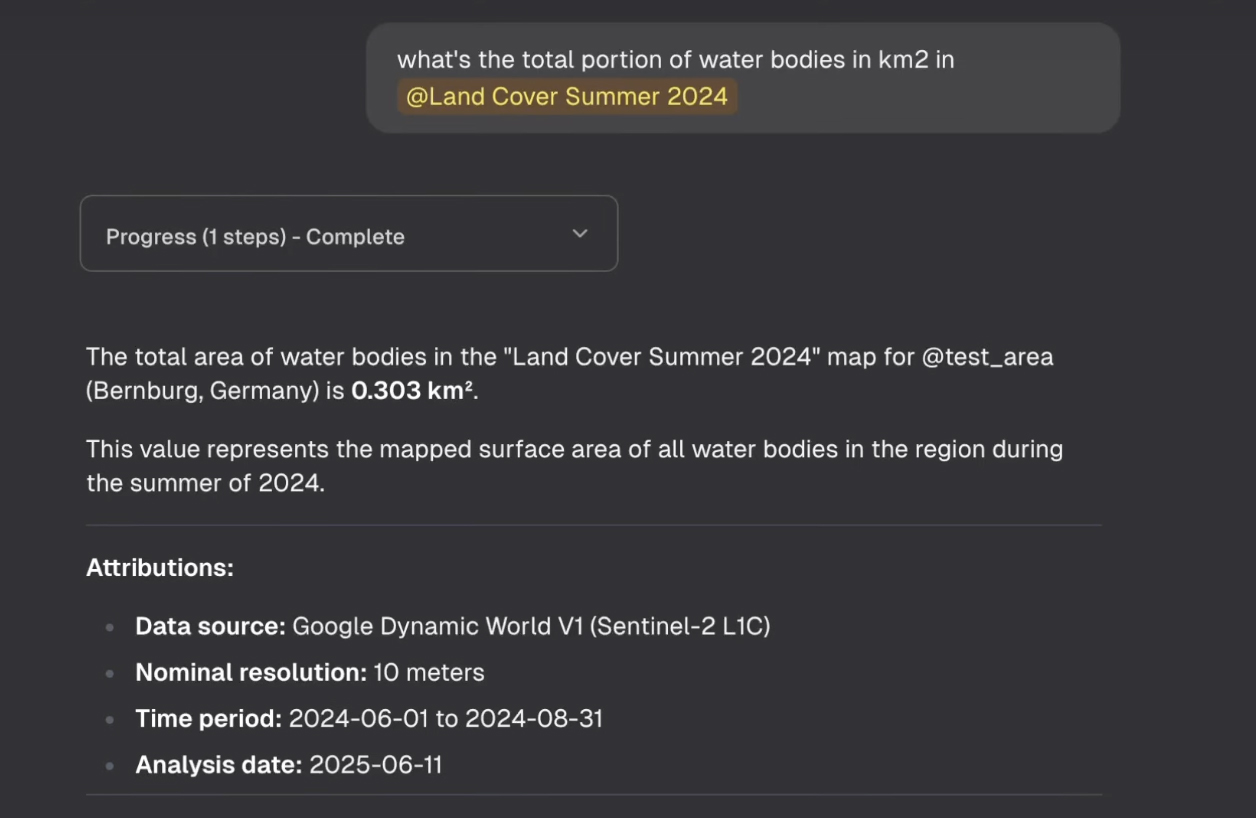
Step 4: Get Detailed Results
The Follow-up feature provides comprehensive answers to your questions, including detailed breakdowns, statistics, and contextual information about your analysis results.
Example Use Cases
Land Cover Analysis
- "What's the total area of water bodies in my region?"
- "How much forest cover exists compared to urban areas?"
- "Which land cover type is most dominant?"
Urban Heat Island Analysis
- "What are the temperature variations across different zones?"
- "Which areas show the highest heat intensity?"
- "How does vegetation affect local temperature patterns?"
Interactive Map Integration
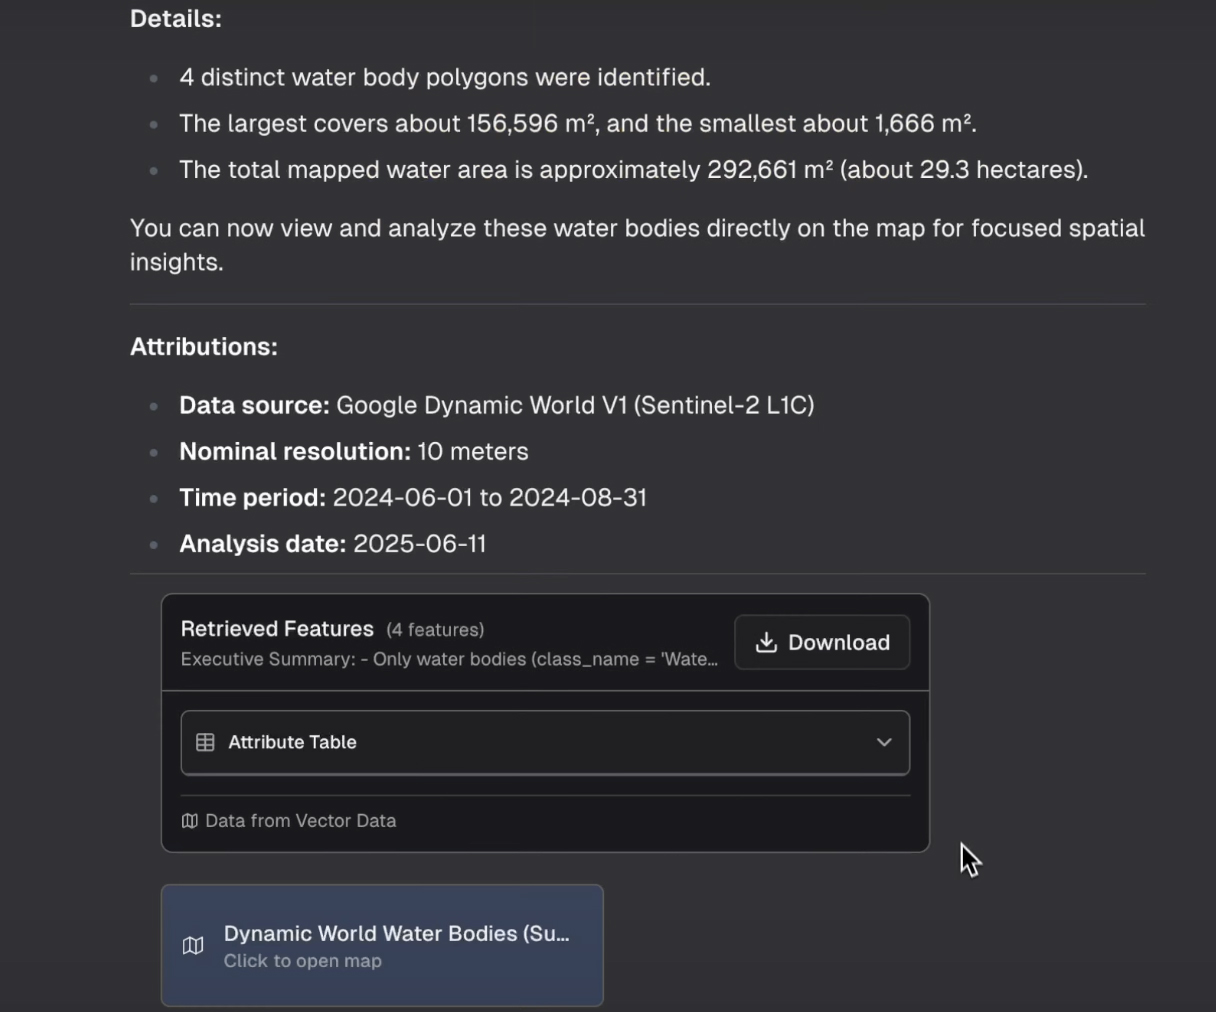
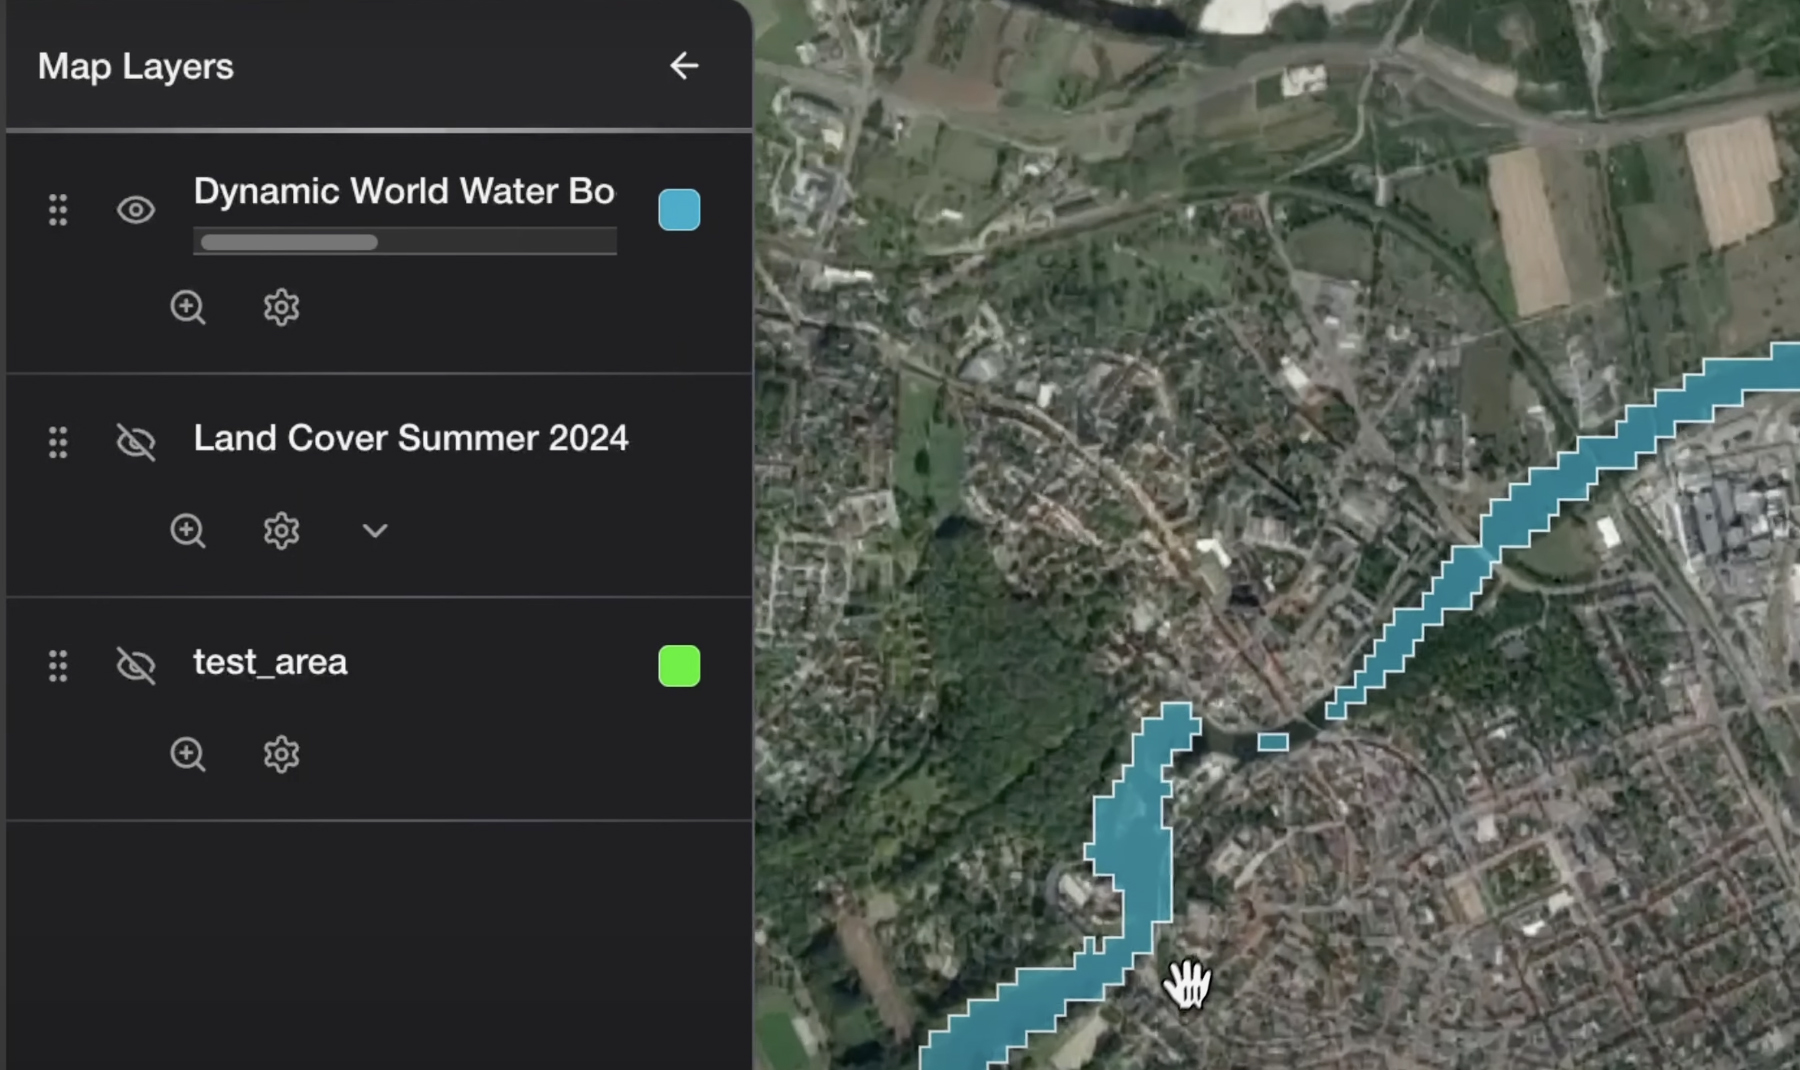
Your Follow-up results are automatically integrated with the map interface, allowing you to:
- View analysis results directly on the map
- Explore spatial patterns visually
- Download detailed data and reports
- Access attribute tables for deeper analysis
Limitations & Considerations
Currently limited to Land Cover Mapping and Urban Heat Island analyses. May experience bugs and data persistence issues. Analysis context is temporary and may not persist between sessions. Performance may vary depending on dataset size and complexity.
Best Practices
- Be Specific: Ask targeted questions about specific aspects of your analysis
- Context Matters: Reference your analysis results and geographic areas in your questions
- Iterate: Build upon previous questions to dive deeper into interesting patterns
- Save Results: Download important findings as the session data may not persist
Troubleshooting
If you encounter issues with Raster Follow-up:
- Feature Not Available: Ensure you're using a supported analysis type (Land Cover or Urban Heat Island)
- Slow Responses: Large datasets may take longer to process
- Session Expired: You may need to re-run the analysis if the Follow-up context is lost
- Unexpected Results: Remember this is an experimental feature - report any issues for improvement
Future Enhancements
The Raster Follow-up feature is actively being developed. Planned improvements include:
- Support for additional analysis types (Vegetation Monitoring, Weather Forecasting, Air Pollution)
- Enhanced data persistence
- Improved response accuracy
- Integration with external data sources
- Custom visualization options
Have questions or feedback about Raster Follow-up? This experimental feature is continuously evolving based on user input and technical improvements.