Analyst: AI-Powered Geospatial Automation
Analyst is an experimental feature. It is currently under active development and available to users who have requested early access. Its functionality and interface may change.
The Analyst feature within the GeoRetina AI platform is an advanced AI-driven agent designed to automate complex geospatial workflows. It represents a significant step in GeoRetina AI's analytical capabilities, enabling more comprehensive and multi-faceted investigations compared to single-prompt data retrieval and visualization. Analyst functions as an intelligent system capable of dynamically planning and executing a diverse range of geospatial analyses. By leveraging GeoRetina AI's extensive data catalog and processing backend, Analyst interprets user requests made in natural language, identifies appropriate datasets, and performs sequences of analytical operations. This approach empowers users to explore a vast spectrum of analytical possibilities without being restricted to predefined analysis types.
What does Analyst do?
The process begins with your prompt. From there, Analyst takes over, automatically managing the entire workflow:
- Understanding Needs: It interprets your request to grasp the core requirements of your analysis.
- Dataset Discovery: Analyst intelligently identifies and sources the most relevant datasets from the platform's data catalog to address your query.
- In-depth Analysis: It performs the necessary geospatial operations and analyses to extract meaningful insights from the data.
- Refinement and Iteration: Analyst can refine its findings based on initial results or further prompts, allowing for iterative exploration.
- Comprehensive Reporting: Finally, it compiles all findings into an interactive, comprehensive report.
Tasks that previously demanded hours of manual work can now be accomplished in minutes. Moreover, Analyst's iterative capabilities allow for easy refinement and deeper exploration of your geospatial questions.
How to Work with Analyst
Working with Analyst involves a straightforward, prompt-driven process. Here's a typical workflow:
-
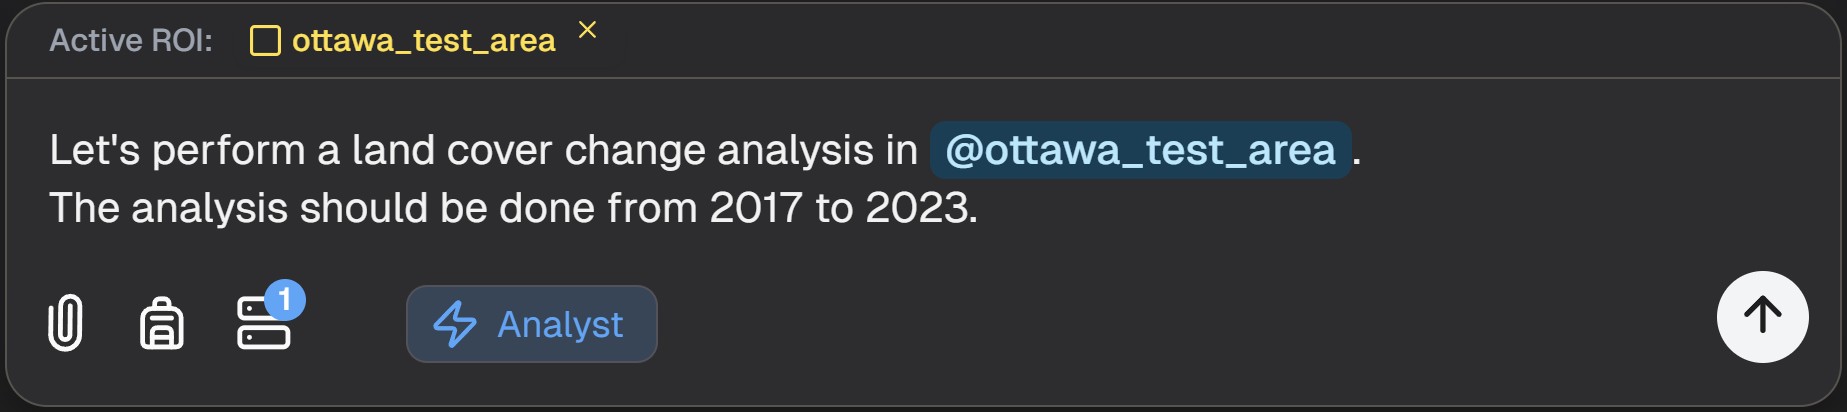
Initiate Your Request: Start by clearly stating your analysis needs in the chat interface. For example, if you need a time-series analysis for land cover change from 2017 to 2023, your prompt might look something like this:
-
Ensure Analyst is Active: Verify that the "Analyst" mode or button is enabled in the GeoRetina AI interface. This indicates that your complex queries will be routed to the Analyst agent.
Important: Keep the Analyst button enabled until you have confirmed and initiated the analysis (Step 5).
-
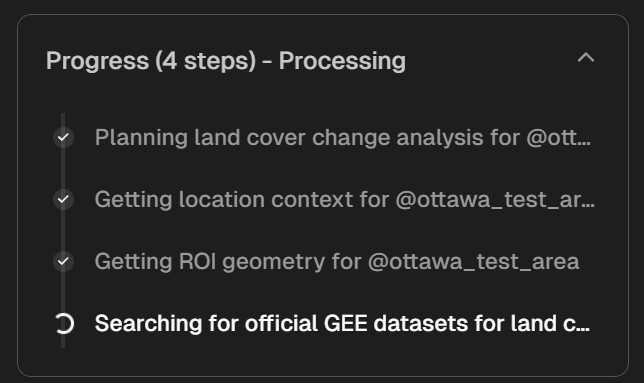
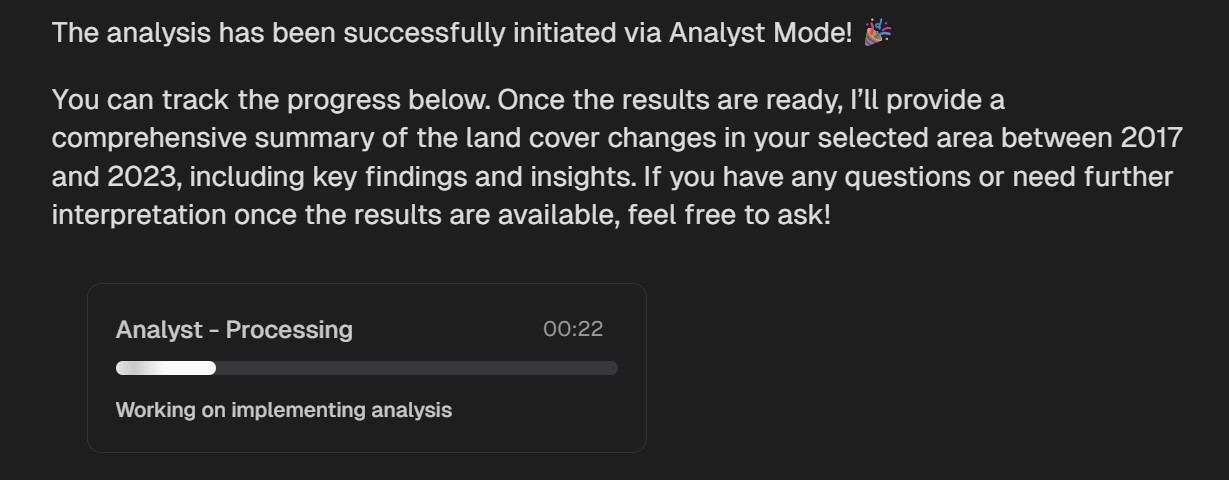
Initial Research and Planning: Once your request is submitted, Analyst will perform initial research to identify suitable datasets and outline a potential workflow for your analysis. You'll see progress indicators as it works.
-
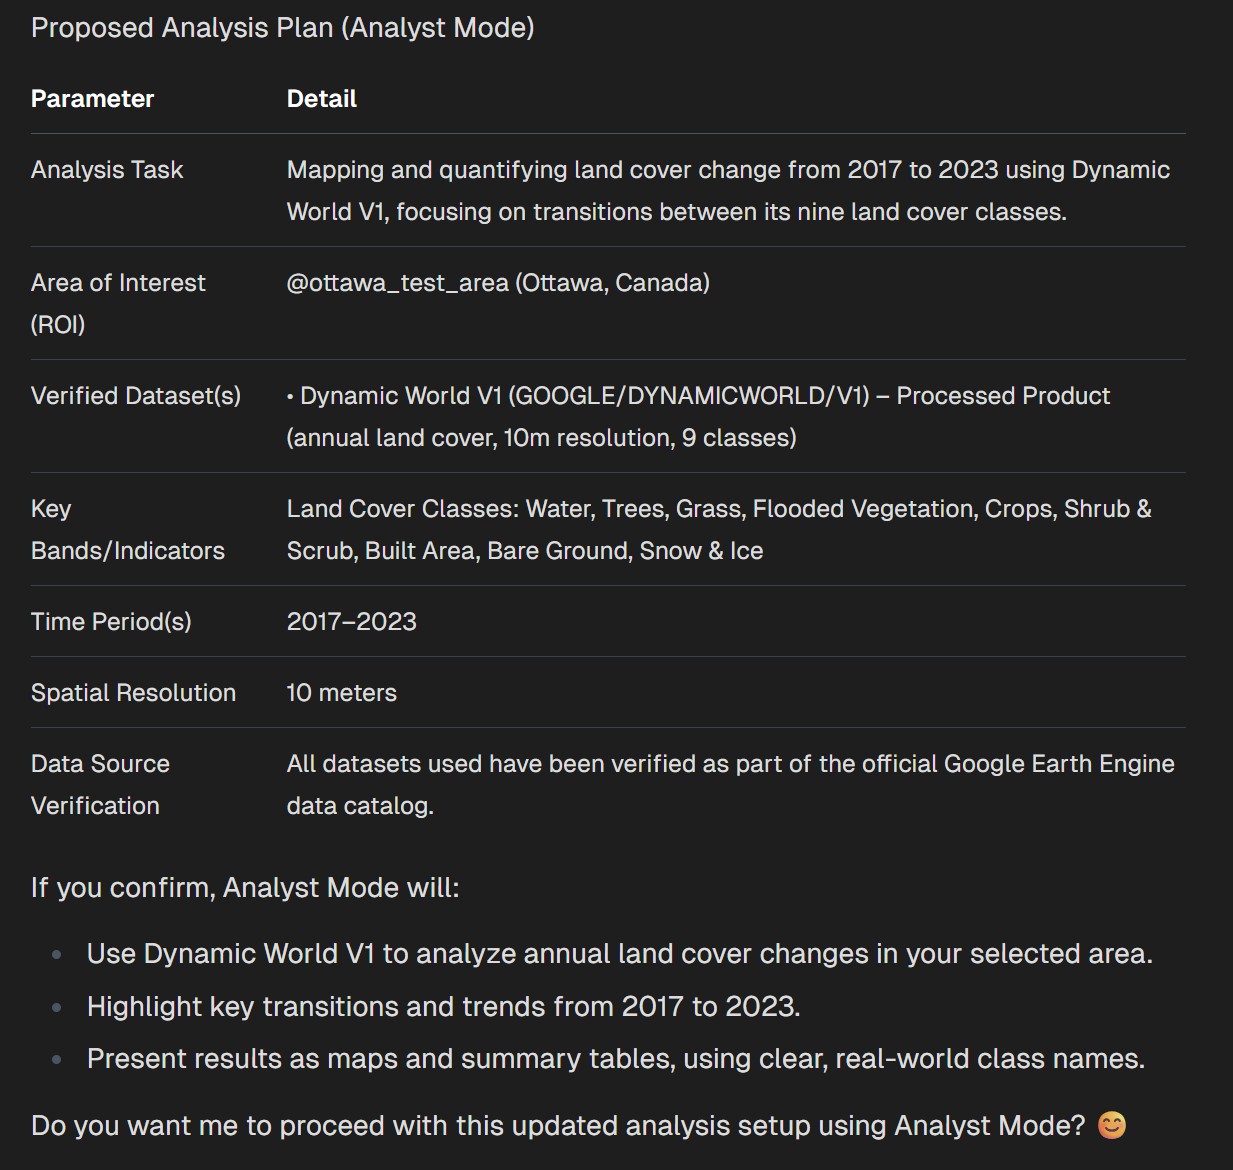
Review the Proposed Plan: After its shallow research, Analyst will present a summary of its findings and the steps it intends to take. This is your opportunity to review the plan before committing to the full analysis.
-
Confirm and Initiate Analysis: If you're satisfied with the proposed plan, confirm to initiate the full analysis. Analyst will then proceed with the deeper computations.
Note: Depending on the size of your selected area of interest and the complexity of the requested analysis, the process may take up to 30 minutes or longer to complete.
-
Access Your Report: Once the analysis is complete, a report will be generated. You can typically access this report via a dedicated button or link in the interface.
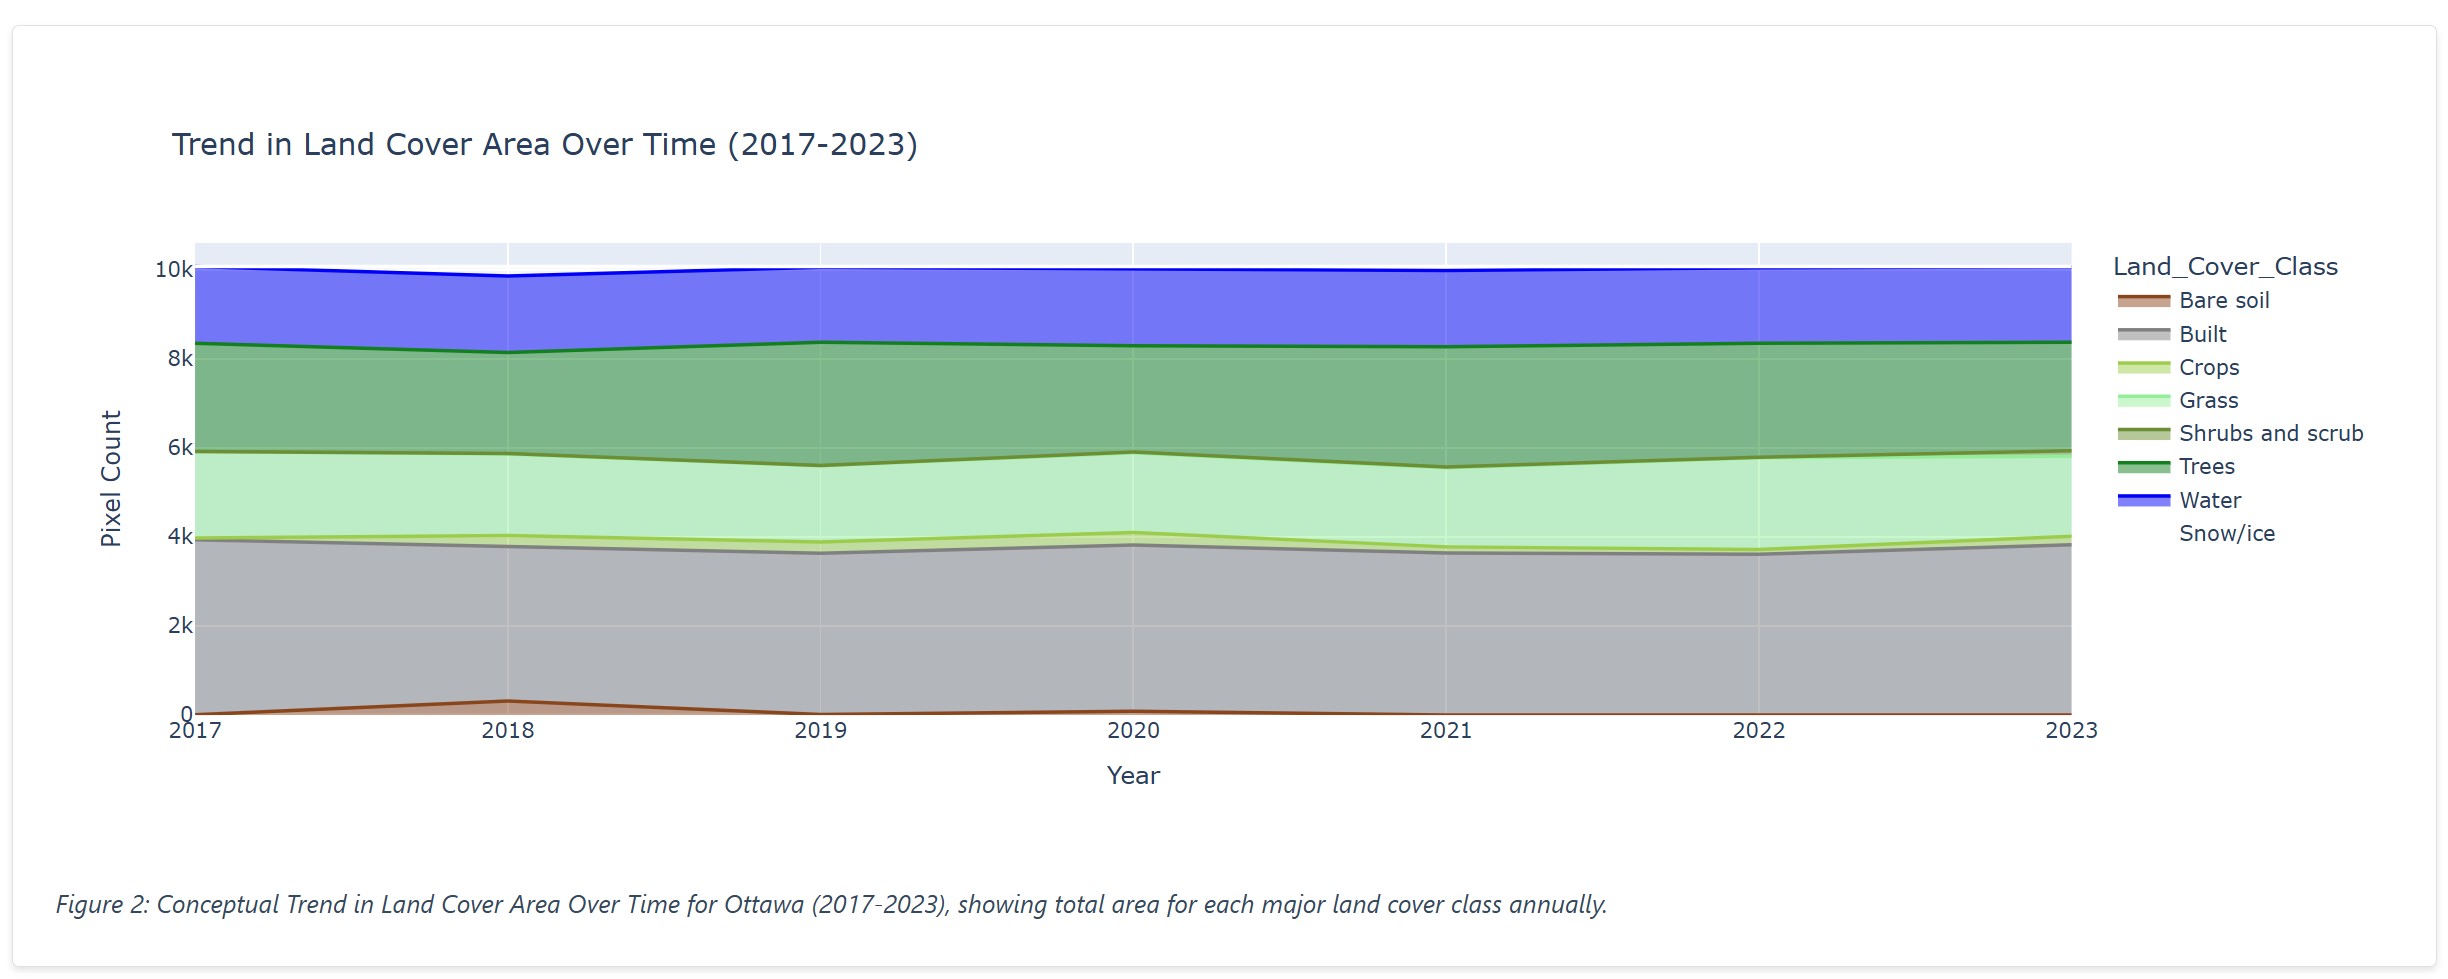
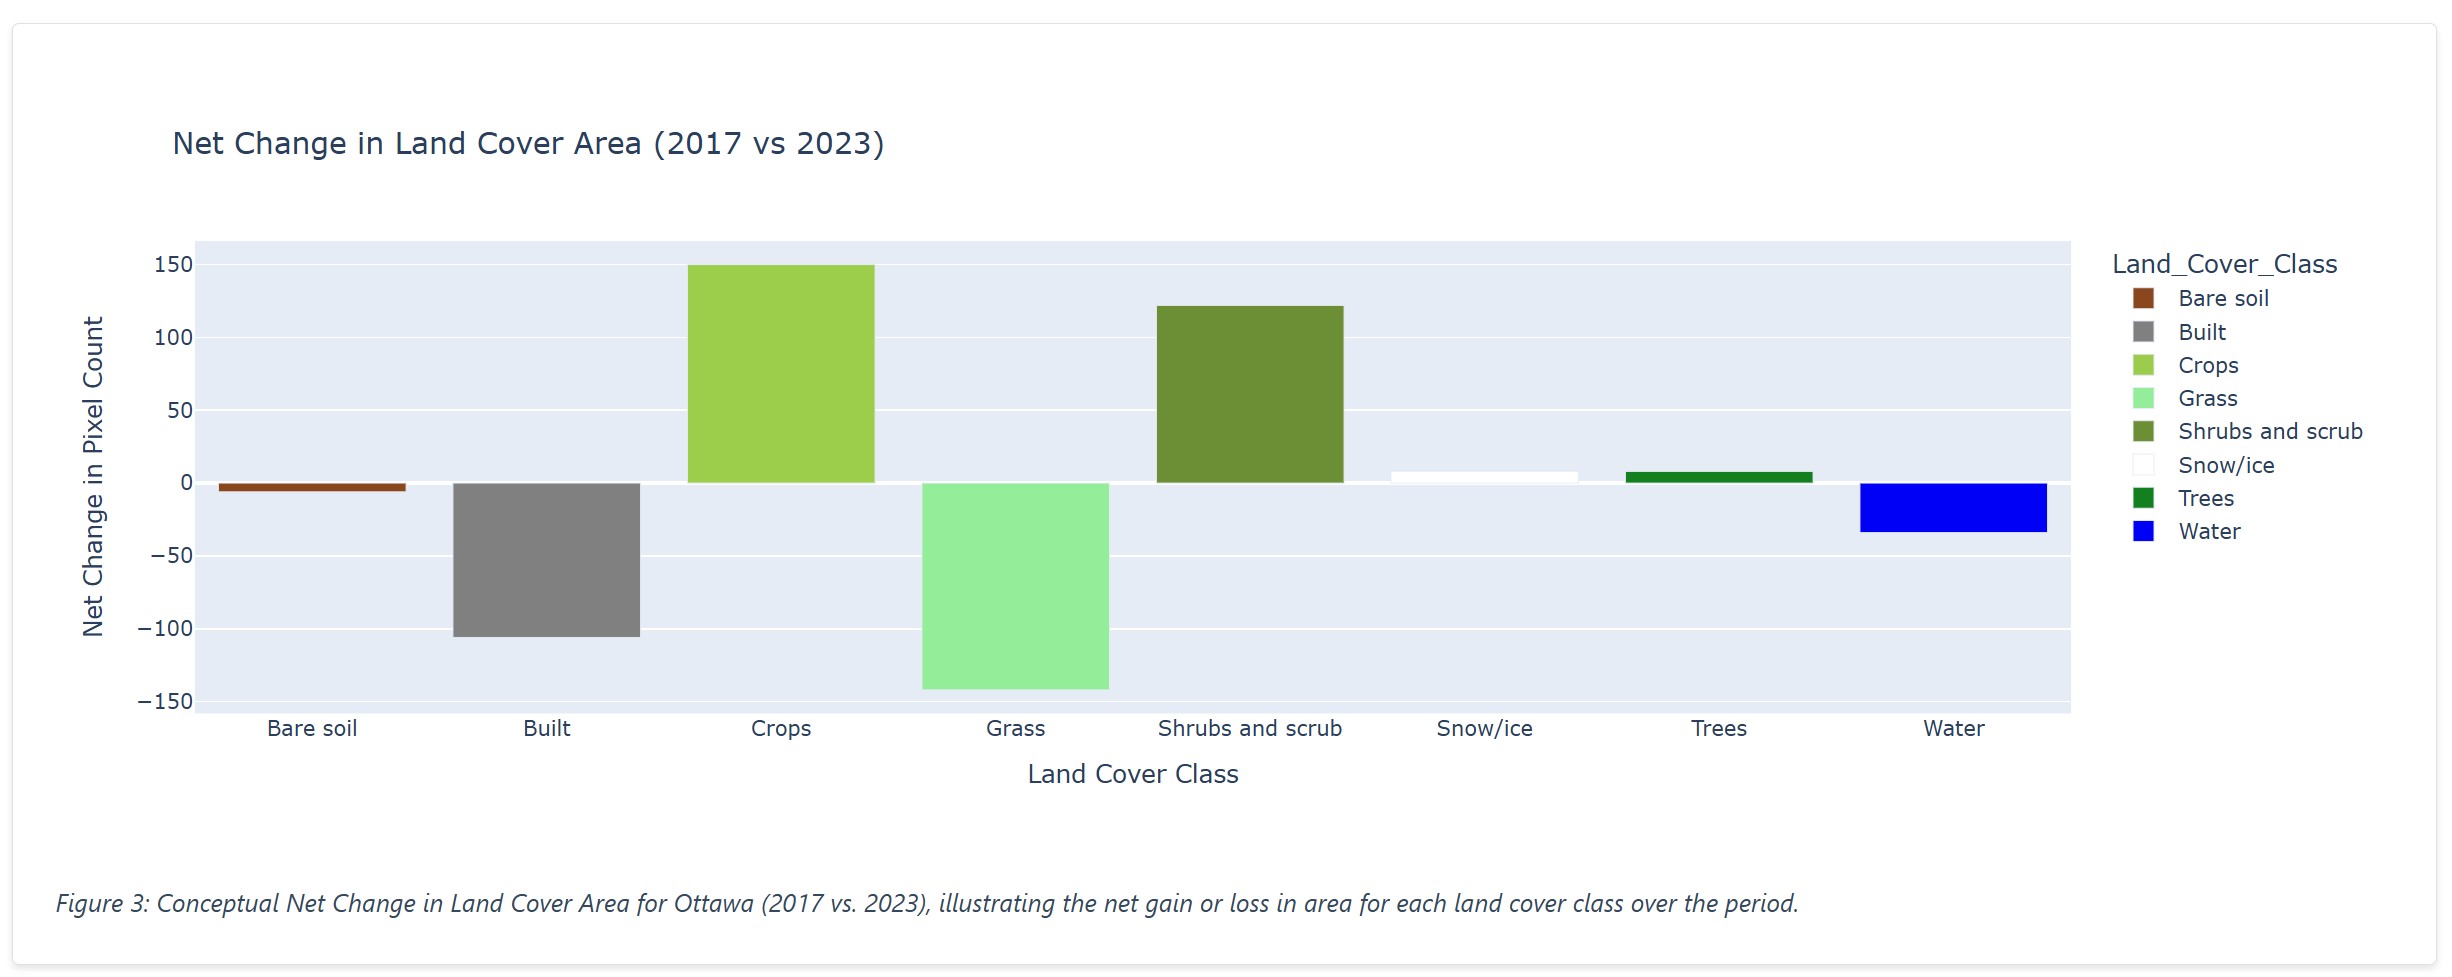
The generated report provides a comprehensive overview of the analysis, including visualizations and key findings. Here's an example of what a report might look like:
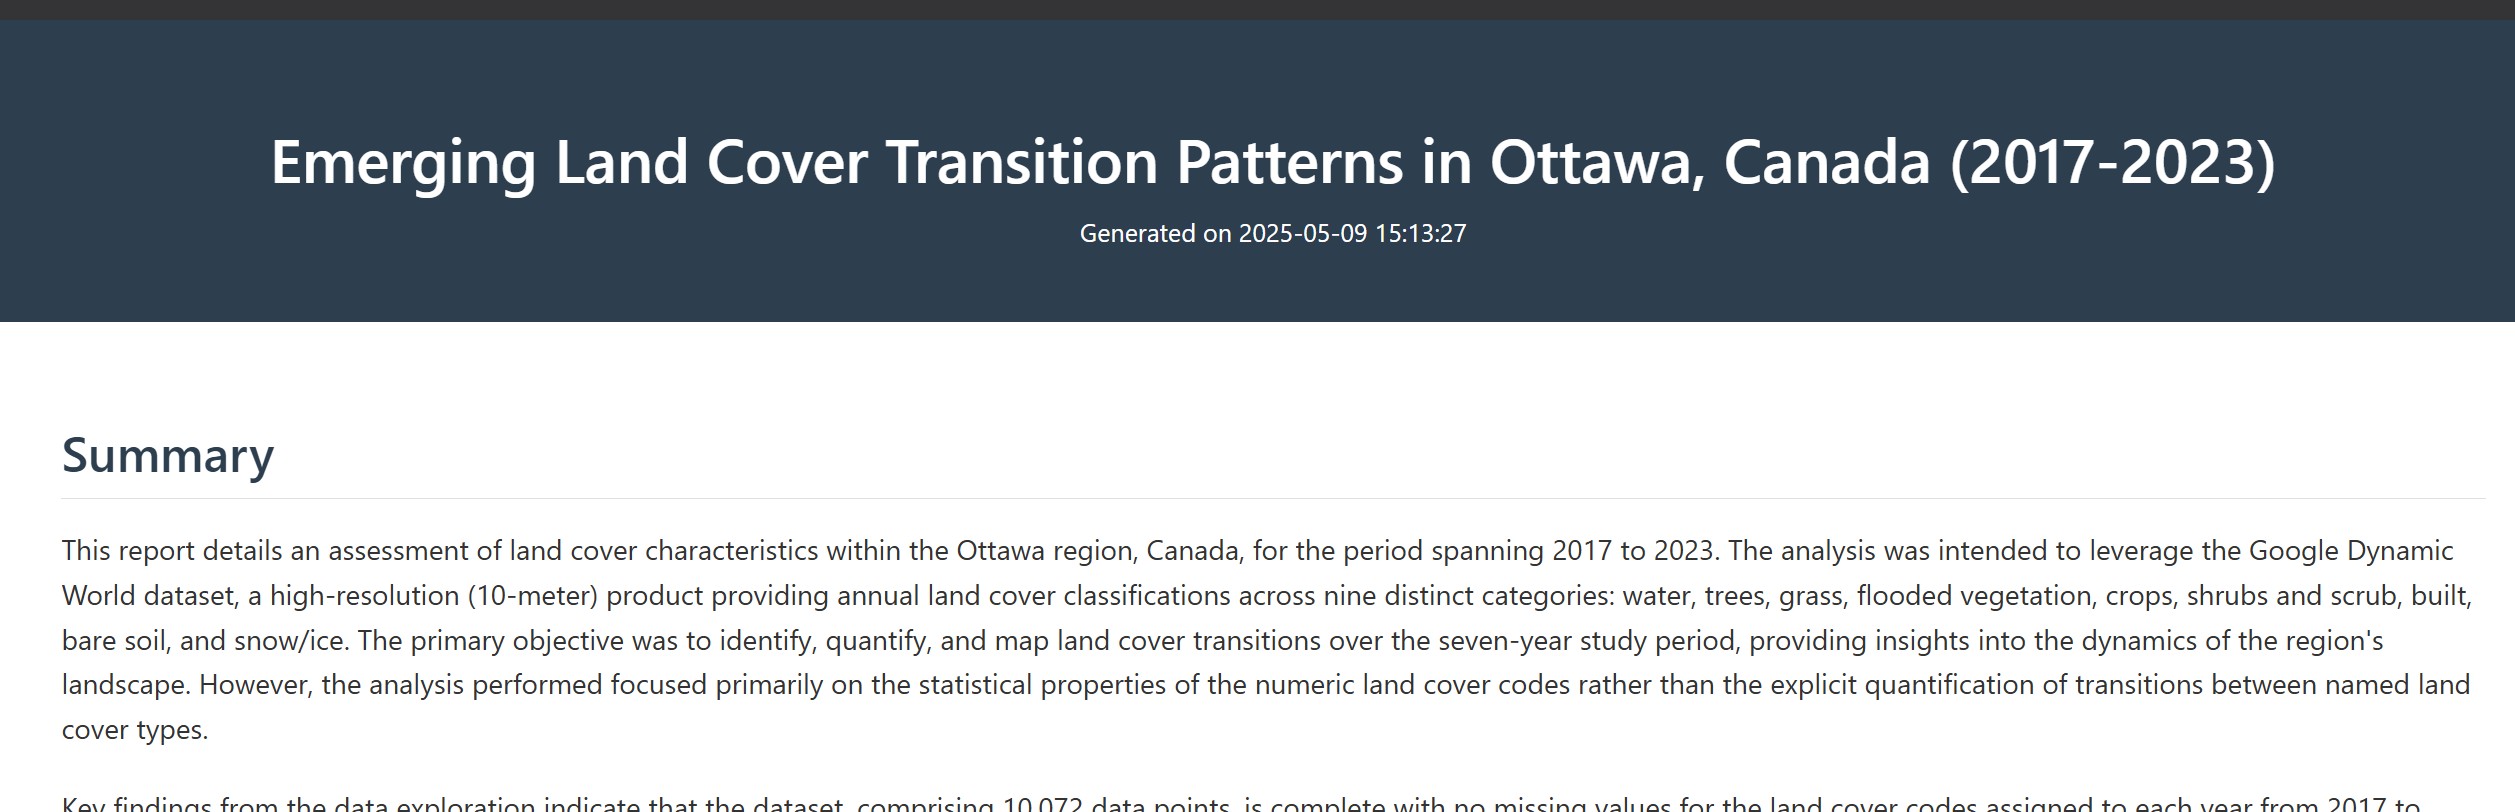
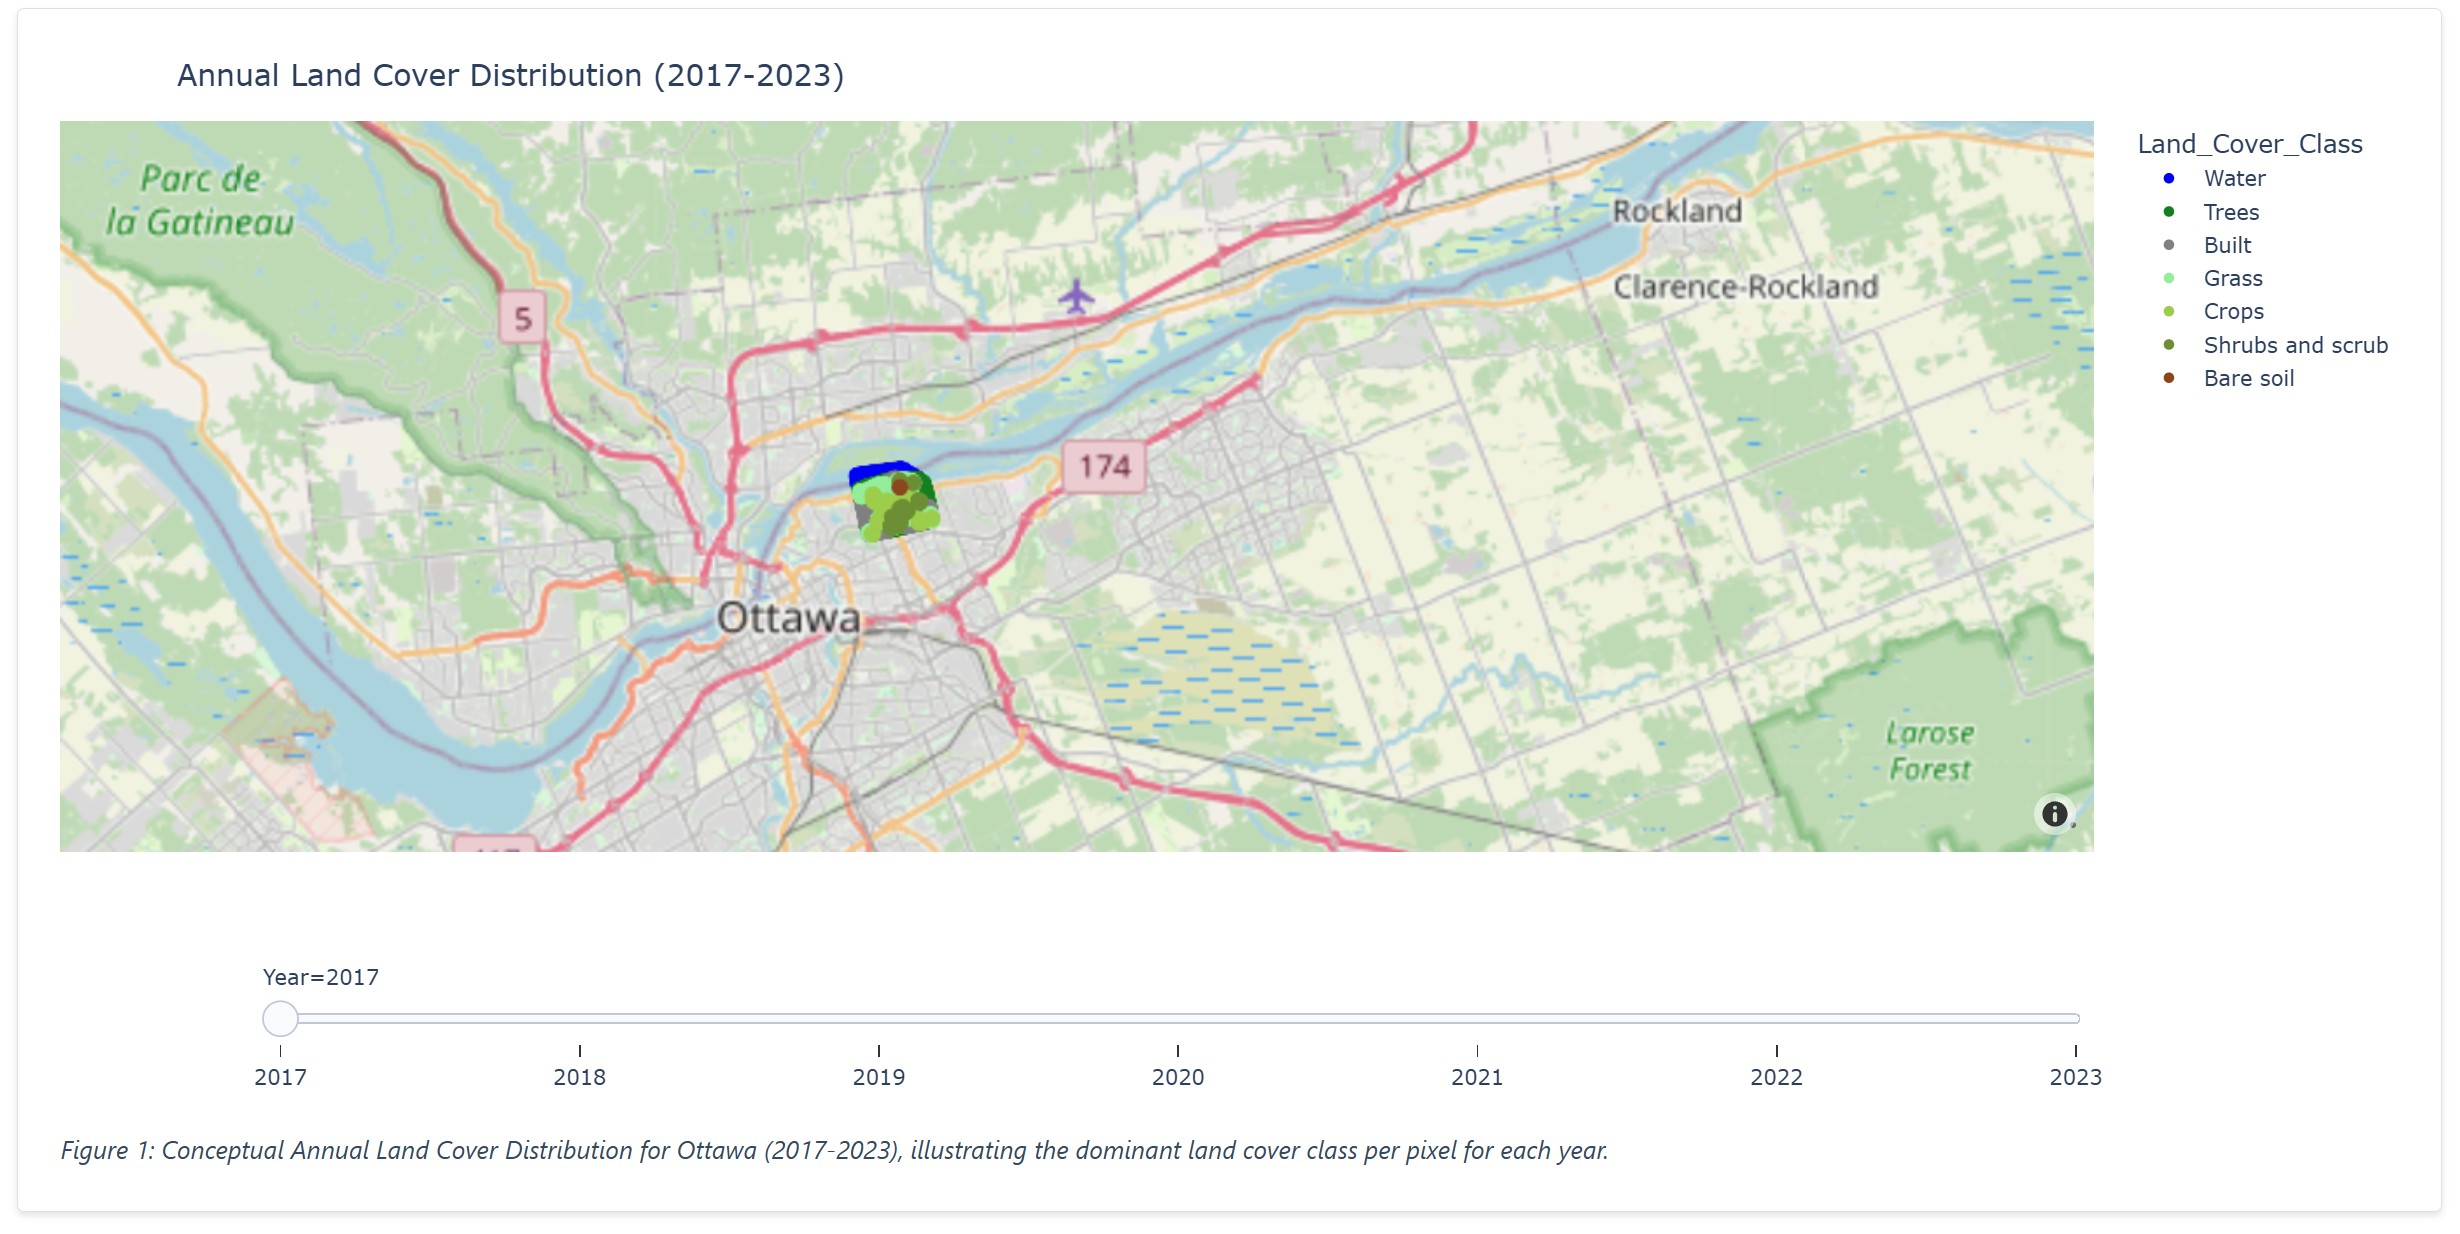
Reports often include interactive visualizations (presented here as static images for documentation purposes):
Important Considerations & Heads-up
As Analyst is an experimental feature, please keep the following in mind:
- Reliability: There is a significant chance (approximately 50%) that an analysis may encounter issues or fail. We are actively working to enhance Analyst's accuracy, reliability, and speed. Please set your expectations accordingly during this experimental phase.
- Area Size: To reduce the likelihood of analysis failure and decrease processing time, we recommend selecting smaller, more focused areas of interest for your analyses.
- Report Performance: Currently, Analyst generates interactive reports. While this provides a rich user experience, reports with large or numerous visualizations may load slowly or, in some cases, cause browser performance issues or crashes. We are developing a hybrid approach to include both interactive and static (non-interactive) visualizations more efficiently in future updates.